Parrot Analytics quantifies the attention economy to provide a 360 degree view into the fragmented TV ecosystem to answer the industry’s most pressing questions. In this article, we examine the trade-offs of release strategies in 2019 to inform OTT programmers’ decisions in 2020.
What Do the Release Strategies of 2019 Reveal about 2020?
Most of the OTT platforms entering the Streaming Wars in 2019-2020 have opted not to follow Netflix’s “binge model” or all-season release strategy and continued to release original content via a more traditional weekly release strategy, but was this the right choice?
And, is there evidence that the future of TV is likely to resemble its past?
How does release strategy impact attention?
Because each strategy has unique advantages and disadvantages for a title’s performance in the attention economy, the choice between releasing all-season or weekly depends at least partially on the goal of an OTT platform.
To answer examine the impact of release strategy, we evaluated the daily and total demand or audience attention each season release received in 2019 at and 3 months after premiere.
Although audiences’ attention and demand are fluid, for the purposes of focusing on comparing the two strategies, we will treat demand and attention for a show as finite (within 3 months) and analyze it via two frameworks:
1. The Mileage Model: In this framework, we examine the attention a title earns on a daily basis as a percentage of its total attention (within 3 months after premiere), in order to identify when a title is likely to get its greatest attentional mileage.
2. The Fuel Burn Model: In this framework, we examine the daily accumulation of attention as a percentage of the total attention a season earns (within 3 months after premiere) — in other words, we evaluate the gradual growth in total attention from 0 to 100%. This identifies the rate at which a title burns its total attention much like a rocket burning its fuel.
Acquisition: Full speed ahead
All new platforms and channels aim at acquiring audiences at launch. They aim to leverage original content that earns a lot of mileage or attention from audiences early on.
So, using demand (the currency of attention), we ask when does each release strategy seize most of its attention or earning its best mileage?
Our data reveals that all-season releases, on average, are acquisition optimized. The peak of daily demand for an average all-season released season is 1.5-1.7x greater than the peak of the average weekly released season. They are most likely to seize attention of potential subscribers at launch.
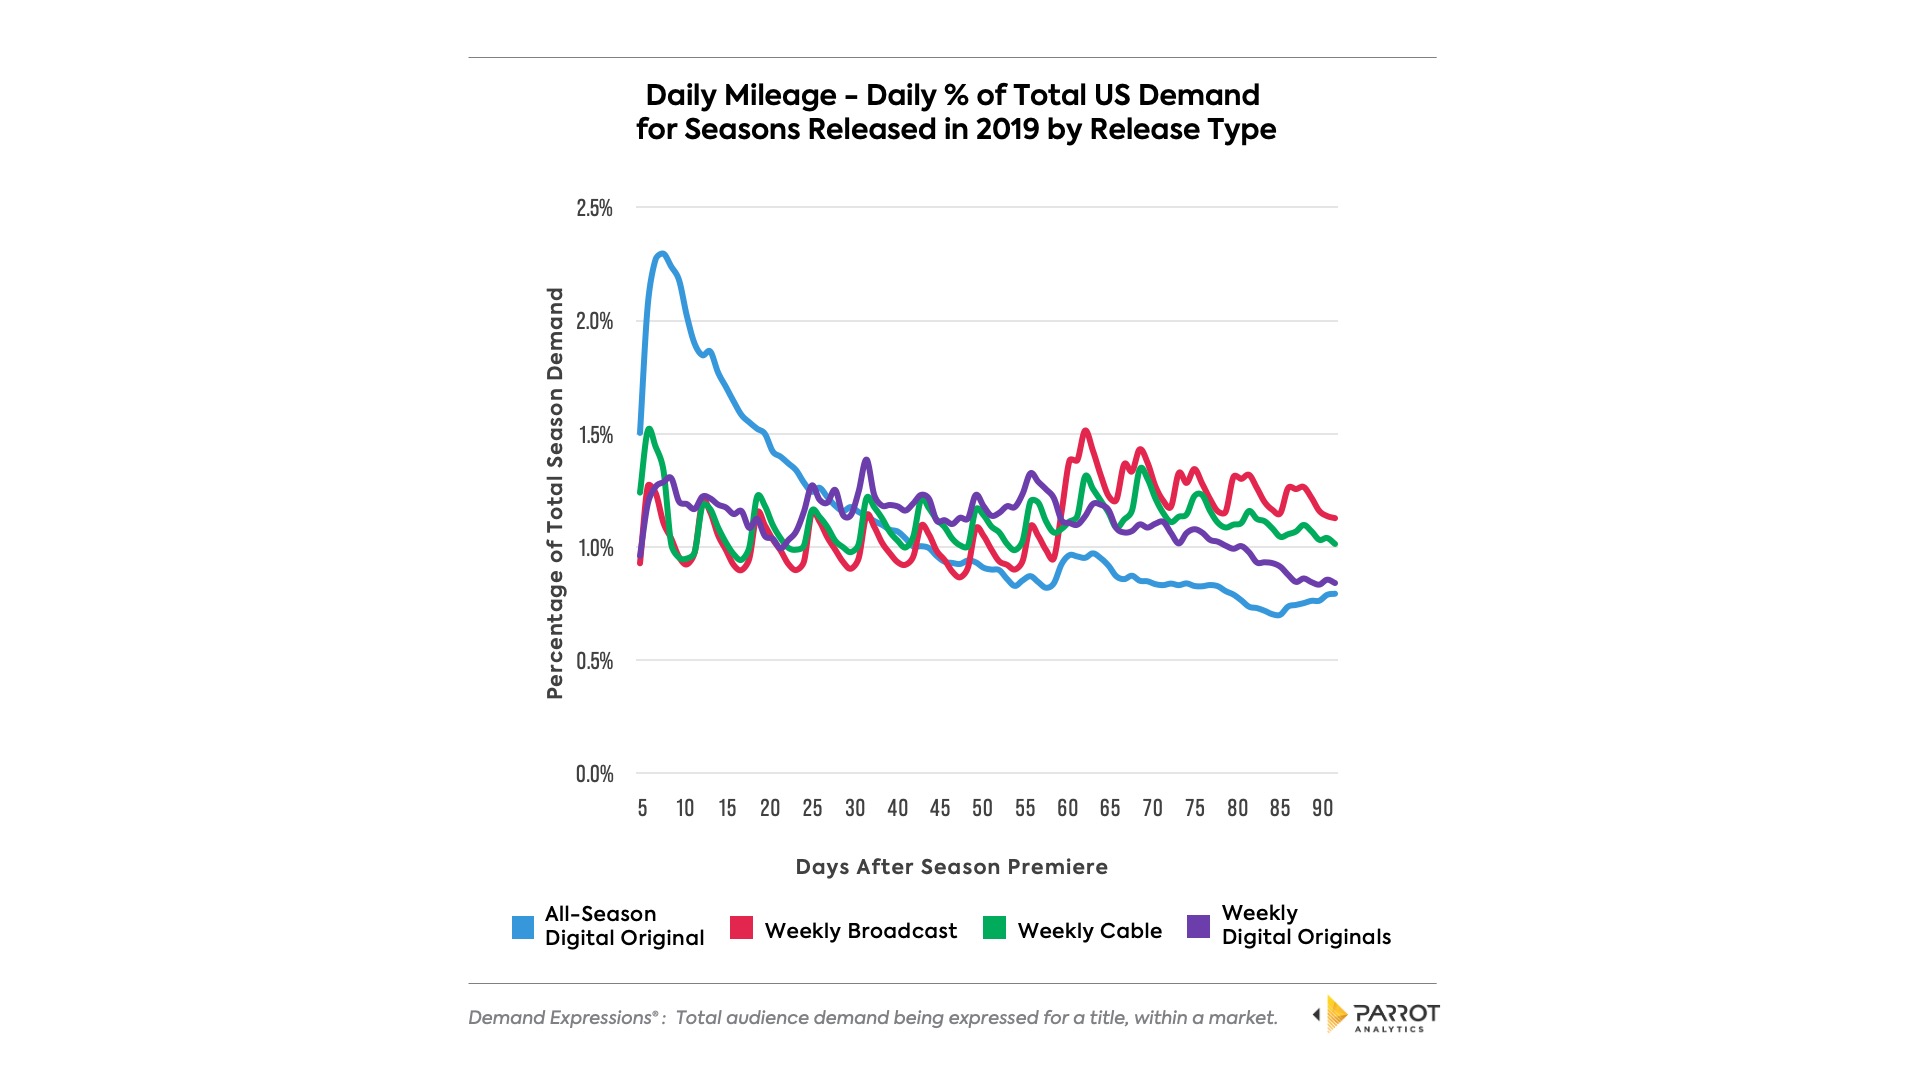
Chart 1 depicts the average 2019 season’s (with 10-13 episodes) daily percentage of its total US demand 90 days after premiere compared by release strategy and platform of release. For more on methodology, see below the article.
As compared to all-season releases, which gain the greatest mileage on day 7, weekly releases’ peak (or greatest mileage) occurs near day 56 or near the finale of a title.
Due to the early advantage and greater peak, all-season released digital originals, on average, can be more likely to capture audiences and thus subscribers attention.
Retention: Slow and Steady Wins the Race
Let’s consider another perspective.
Using cumulative demand, we continue to use demand (the currency of attention), and ask which release strategy burn its attentional currency (like fuel) more quickly?
Weekly released seasons, on average, best optimize for retention by slowly using their total demand or audience’s attention. Weekly releases, on average, take 18-25 more days to burn 50% of their fuel than the average all-season release.
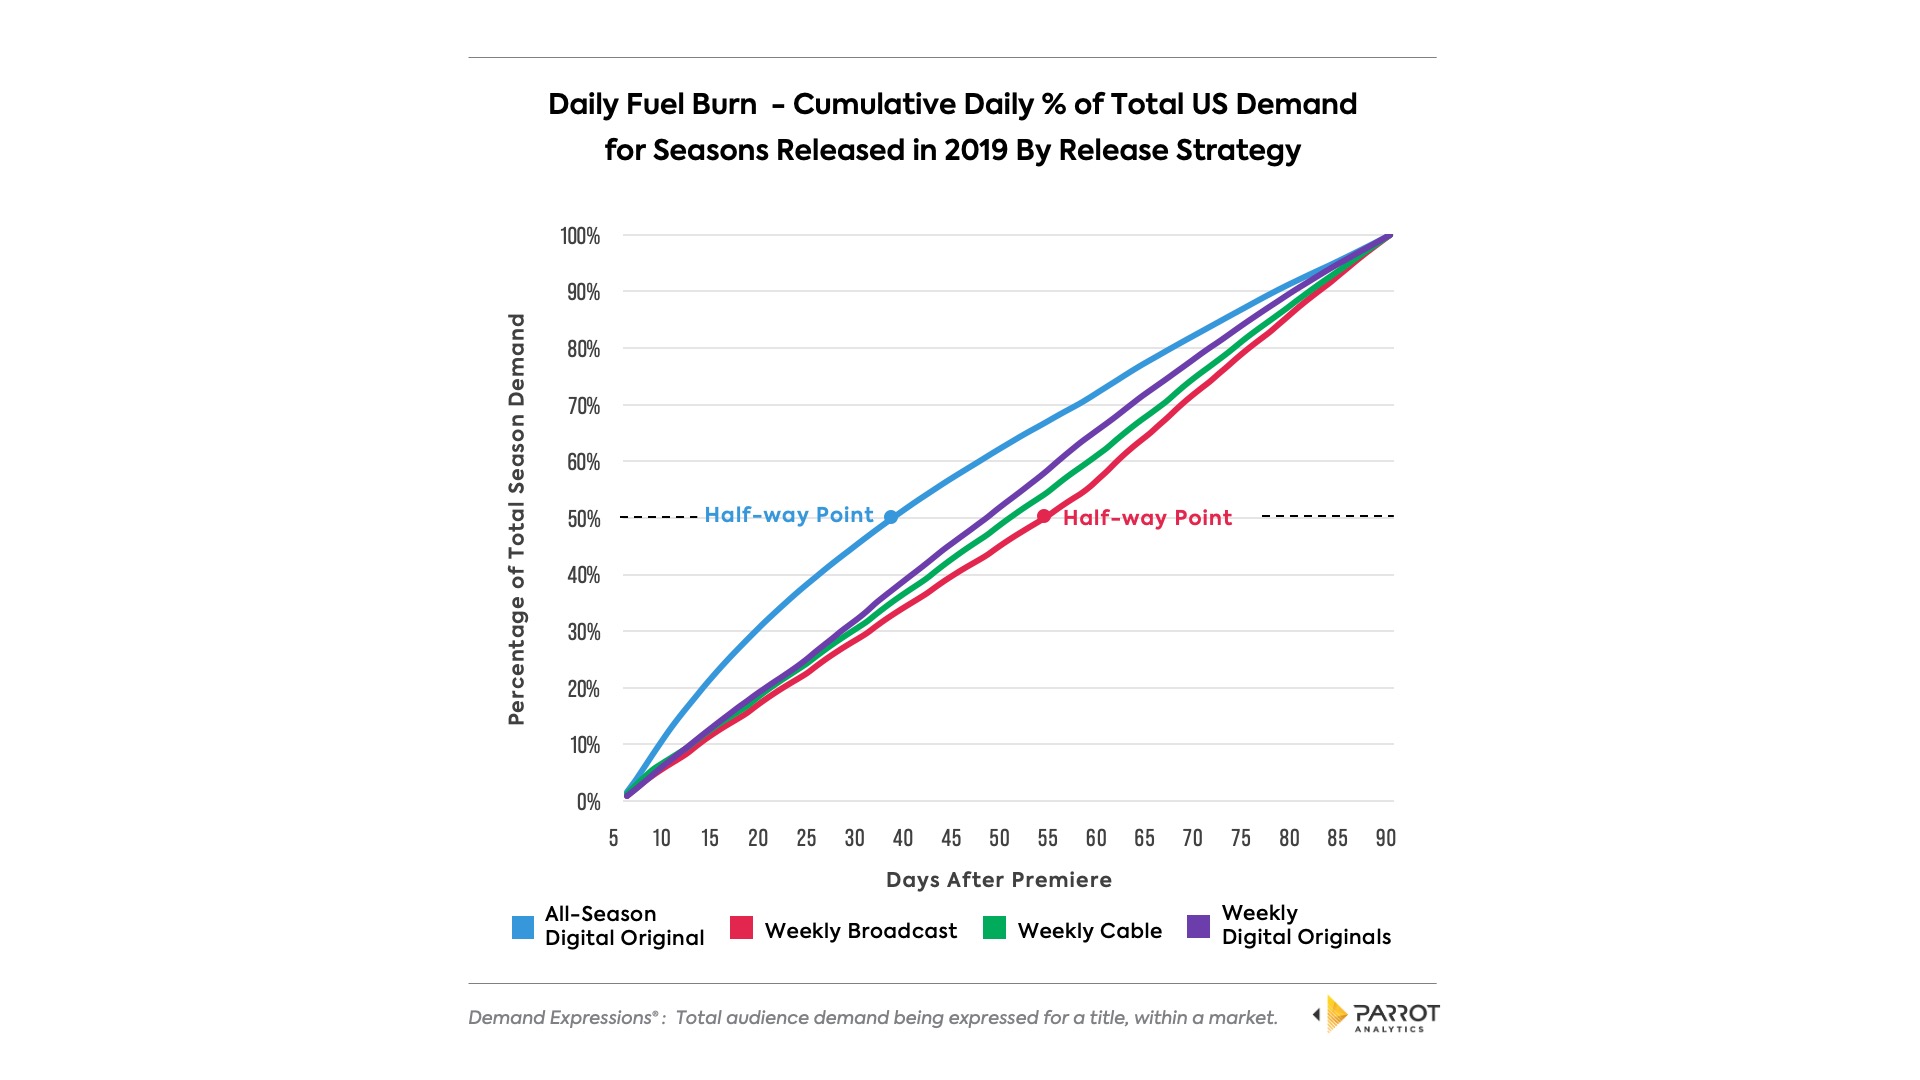
Chart 2 compares the average cumulative daily % of total US demand 90 days after premiere for all titles with a season released in 2019 with 10-13 episodes by release strategy.
At the half-way point, the average weekly released season extracted its demand about 31-37% slower (depending on platform) than the average all-season release.
Given that the slower a show burns through its fuel (attention) the longer people are likely to remain subscribed to their platform, the average weekly release’s rate of fuel usage is optimized for retention. Yet, there is also the risk of losing audiences’ attention between episodes.
Rockets Launches
We can boil our finding thus far down into a simple but, nonetheless, effective analogy.
Imagine two rockets...
The first rocket, let’s call this the all-season release rocket, is big and burns its fuel quickly at first, getting a lot of mileage early on, but then slowing down later in the race (metaphorically losing steam).
The second rocket, let’s call this the weekly release rocket, is smaller and burns its fuel slowly, getting less mileage, but remaining at a more steady pace.

Does the Fuel Burn Differ Among Tentpoles?
New OTT platforms (ex: Disney+, Peacock, HBOmax) are also not so new to the TV industry. They each have experience producing outstanding content in their past.
Our findings suggest that the race among tentpoles may be far more neck-in-neck.
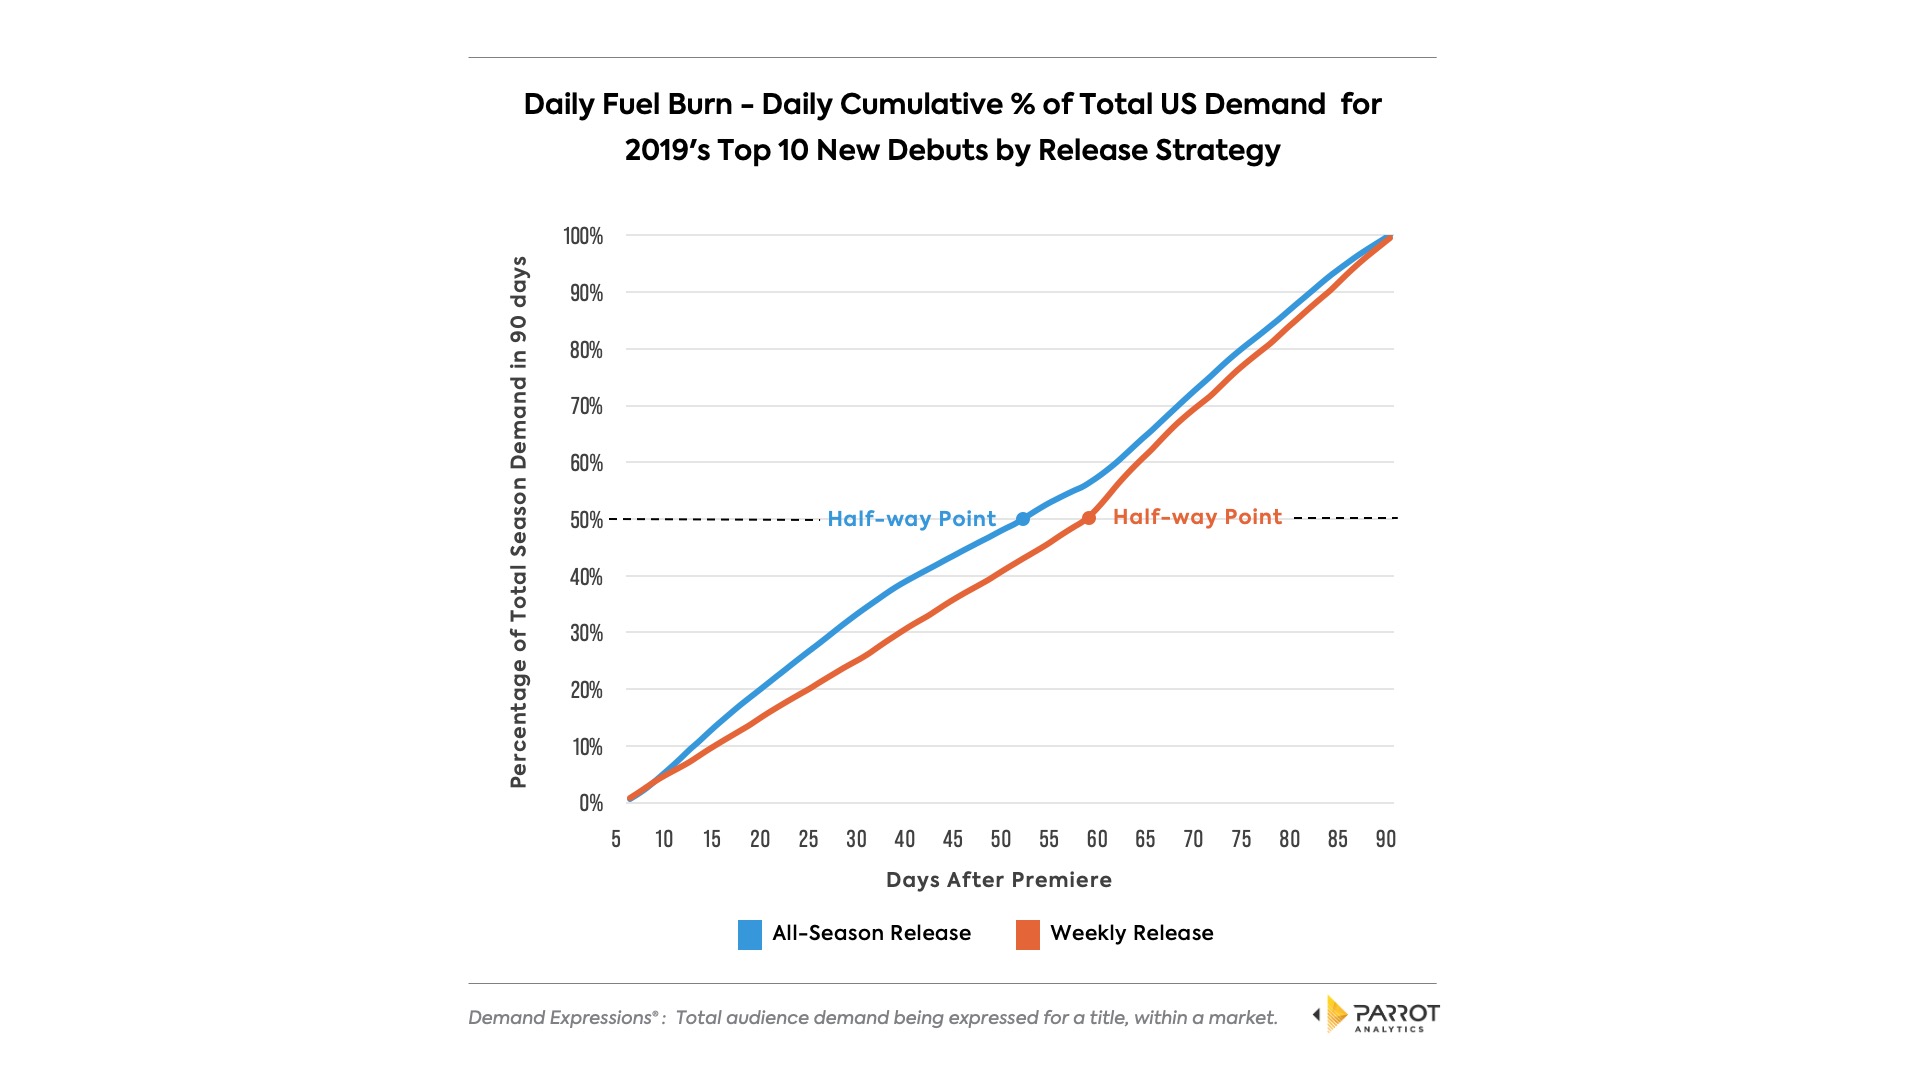
Chart 3 compares new debuts title’s daily cumulative percentage of their total US demand 90 days after premiere by release type, amongst those with the highest average demand in 2019. See methodological information below.
Based on the top 10 debuts of 2019, weekly releases still burn their attentional fuel more slowly than all-season releases, but the difference between the two diminishes. In fact, compared to the average titles both all-season and weekly release tentpoles delay their half-way mark.
Thus, for tentpoles or highly in-demand shows, there is room to experiment, depending on a catalogs’ needs/goals and on other factors such as genre and pre-existing IP.
Conclusion
While it may look like we’re going back to the future as many emerging OTT platforms release content weekly, the current findings suggest this may not remain the case.
All-season releases on average are more likely to catch the attention of audiences and attract new subscribers to the platform due to their peak in daily demand. Yet, after a month each binge released show (on average) declines the rate at which it attracts new audiences. Thus these new subscribers could leave the platform.
On the other hand, weekly released shows are on average retention-optimized. While weekly releases can also acquire audiences, on average, their daily demand as % of their demand peaks at finale and peaks lower. Weekly shows expend their total demand slowly, leading audiences to engage in appointment viewing, keep their subscription, and revisit the platform. The weekly release also provides more to promote their library of content to viewers and keep them engaged.
Yet, the top 10 new debuts of 2019 indicate that the future is rife with opportunities for experimentation.
Stay tuned, in Episode 2 we share a few insiders’ takes on release strategies.
-----------------------------------------------------------
Methodological Considerations
Chart 1/2:
Parrot Analytics’ dataset of seasons released in 2019 (N = 1,162) was categorized into season that released episodes weekly for the most part (not including release 2 or 3 at launch or specials).
Inclusion Criteria: Titles with multiple seasons were included in the analysis because each season counted separately in the analysis. Titles with overlapping season releases were removed from the analysis (4 titles). Seasons with less than 10 episodes or more than 13 episodes in their season, and those without 90 days of data post-premiere were also removed from the analysis (final N = 389). Episode range was selected based upon the average number of episodes per season for all-season and weekly-released seasons as well as based on industry standards. 90 days post-premiere was chosen as the data-frame per season-release so that the majority of weekly seasons’ had aired all episodes.
Analysis: Per season release the data was normalized such that daily demand was calculated as a percentage of total demand at 90 days post-premiere.
Platforms: Broadcast shows are those that aired their 2019 season on ABC, The CW, CBS, or NBC (n = 70). Cable shows are those that did not air their 2019 season on Broadcast, but were released on another linear channel (n = 214). Finally, digital originals in this article refers to all content released on an OTT platform (n = 105).
Descriptive Statistics of Genre
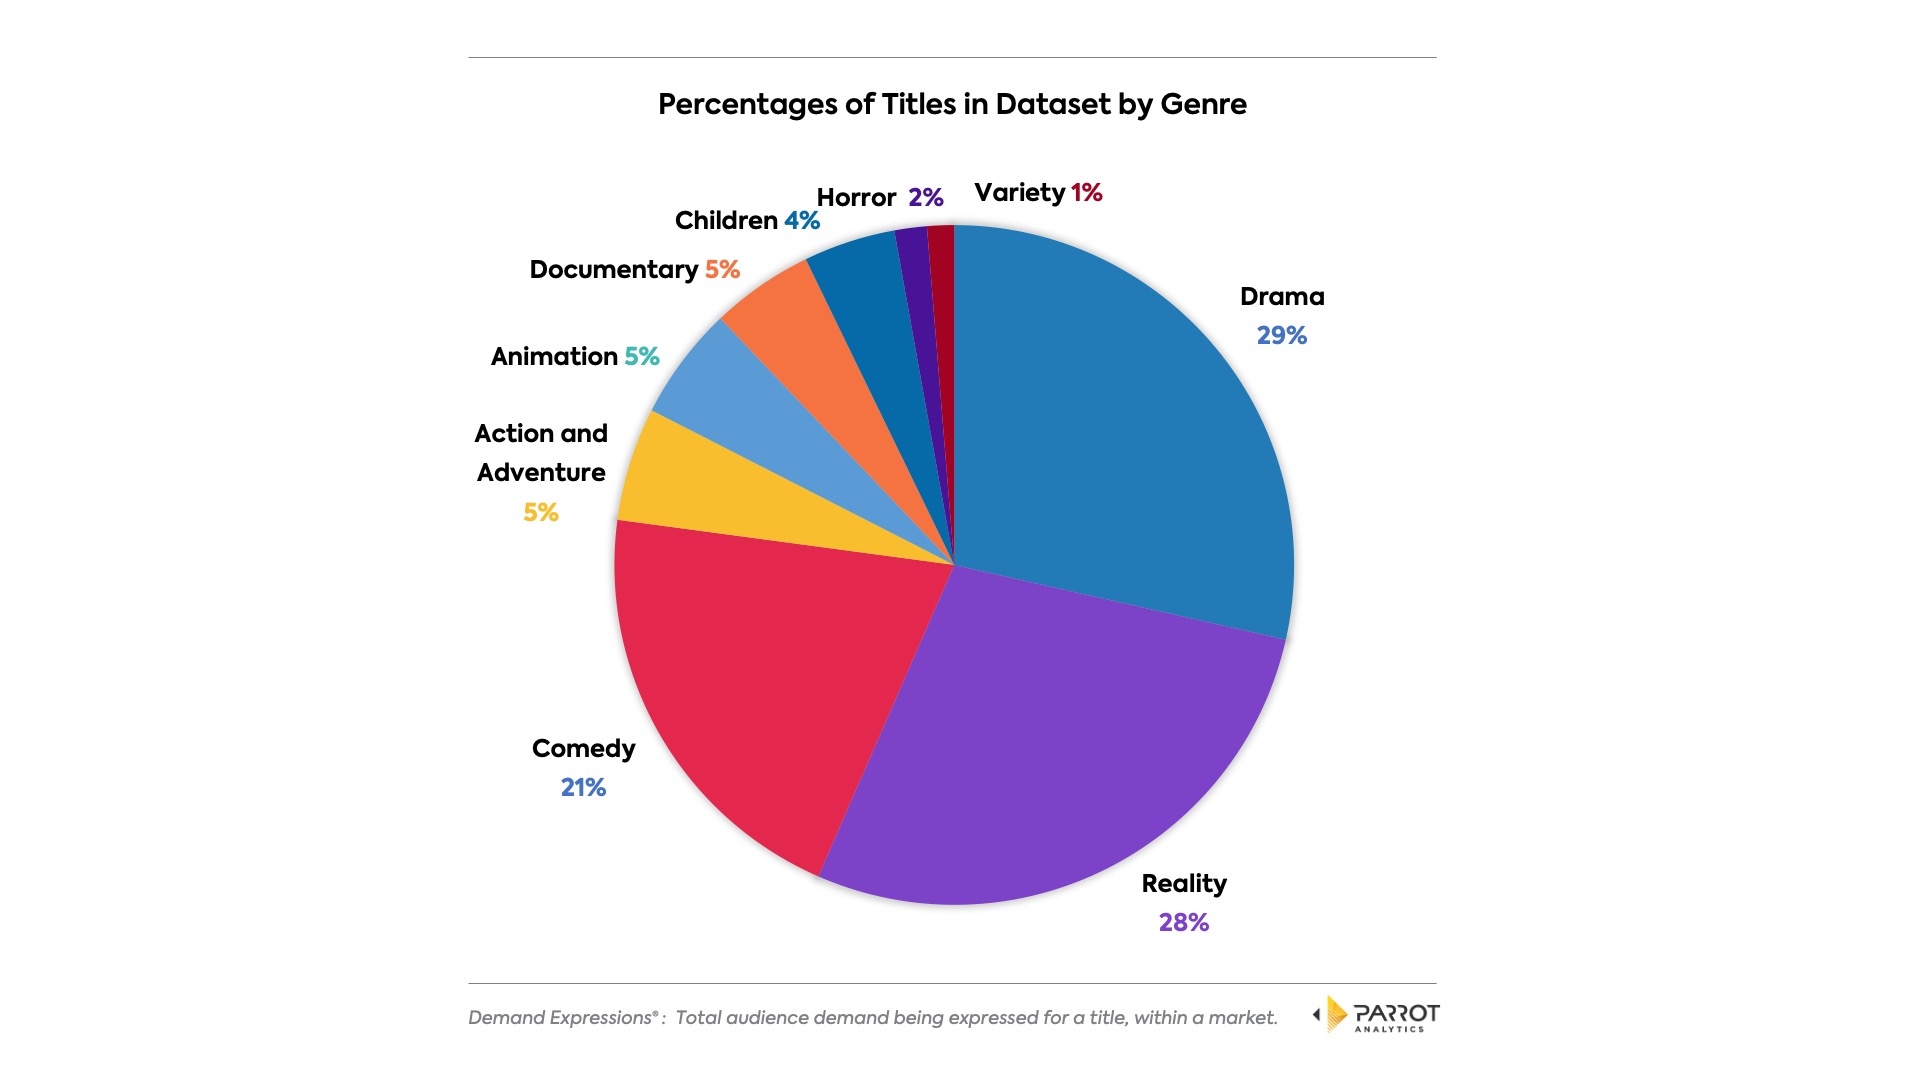
Chart 3:
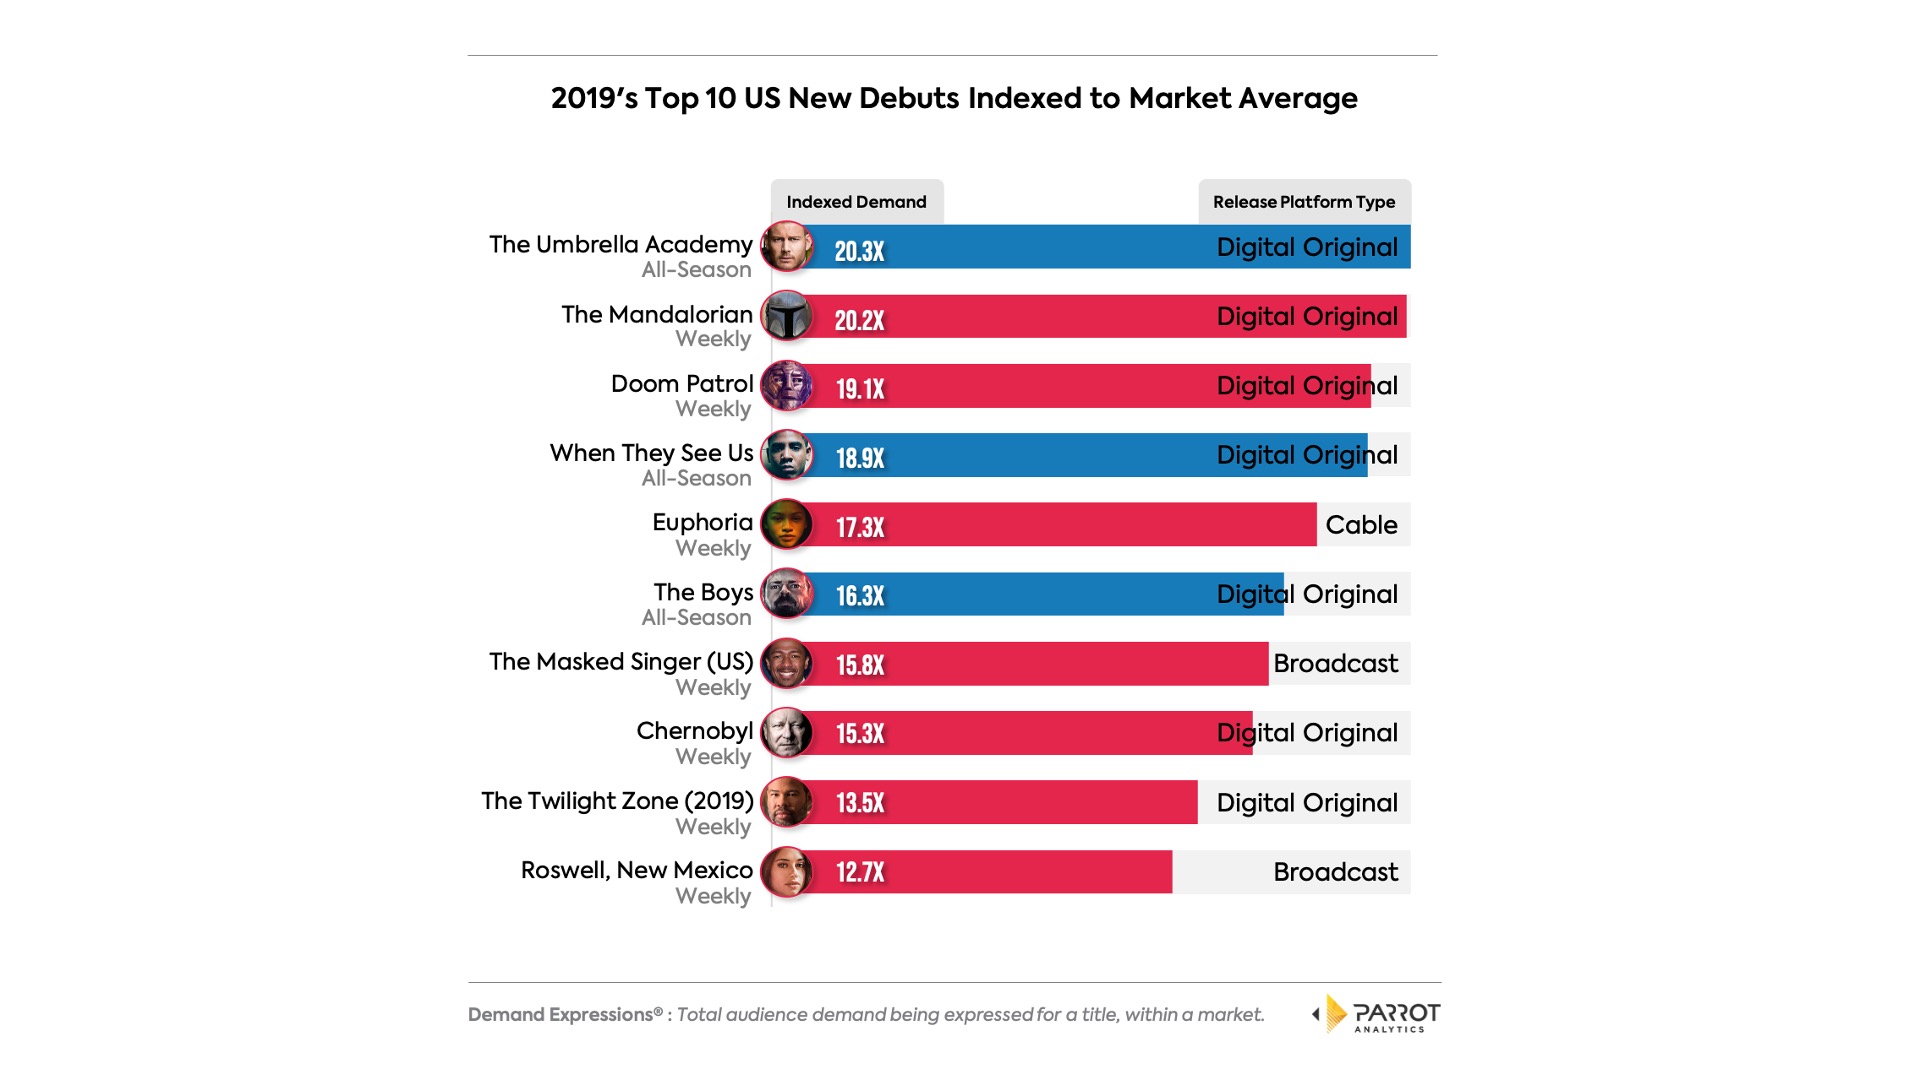
Parrot Analytics’ dataset of all new debuts released in 2019 was used to identify the top 10 based on average demand during 2019. All of the top 10 shows can be classified as outstanding; on average they were 17x more in-demand than the average show in 2019. See below for more details on these shows.
Hungry for more? Please see part 2 of this series.
