Image: Sneaky Pete, Amazon Video
Internal documents obtained by Reuters have recently shed new light on the success Amazon Video is having with 26 million subscribers in the US alone. The document also dives into Amazon’s analytics and how the company evaluates the success of a show using a “cost per first stream” approach. This reveals that the first seasons of The Grand Tour, The Man in the High Castle and Bosch are some of Amazon’s most cost-effective originals to date. Parrot Analytics provides demand measurement across all platforms including SVOD, as well as measuring the popularity of TV series on traditional networks. Let us now take a look at the US domestic numbers, Amazon included.
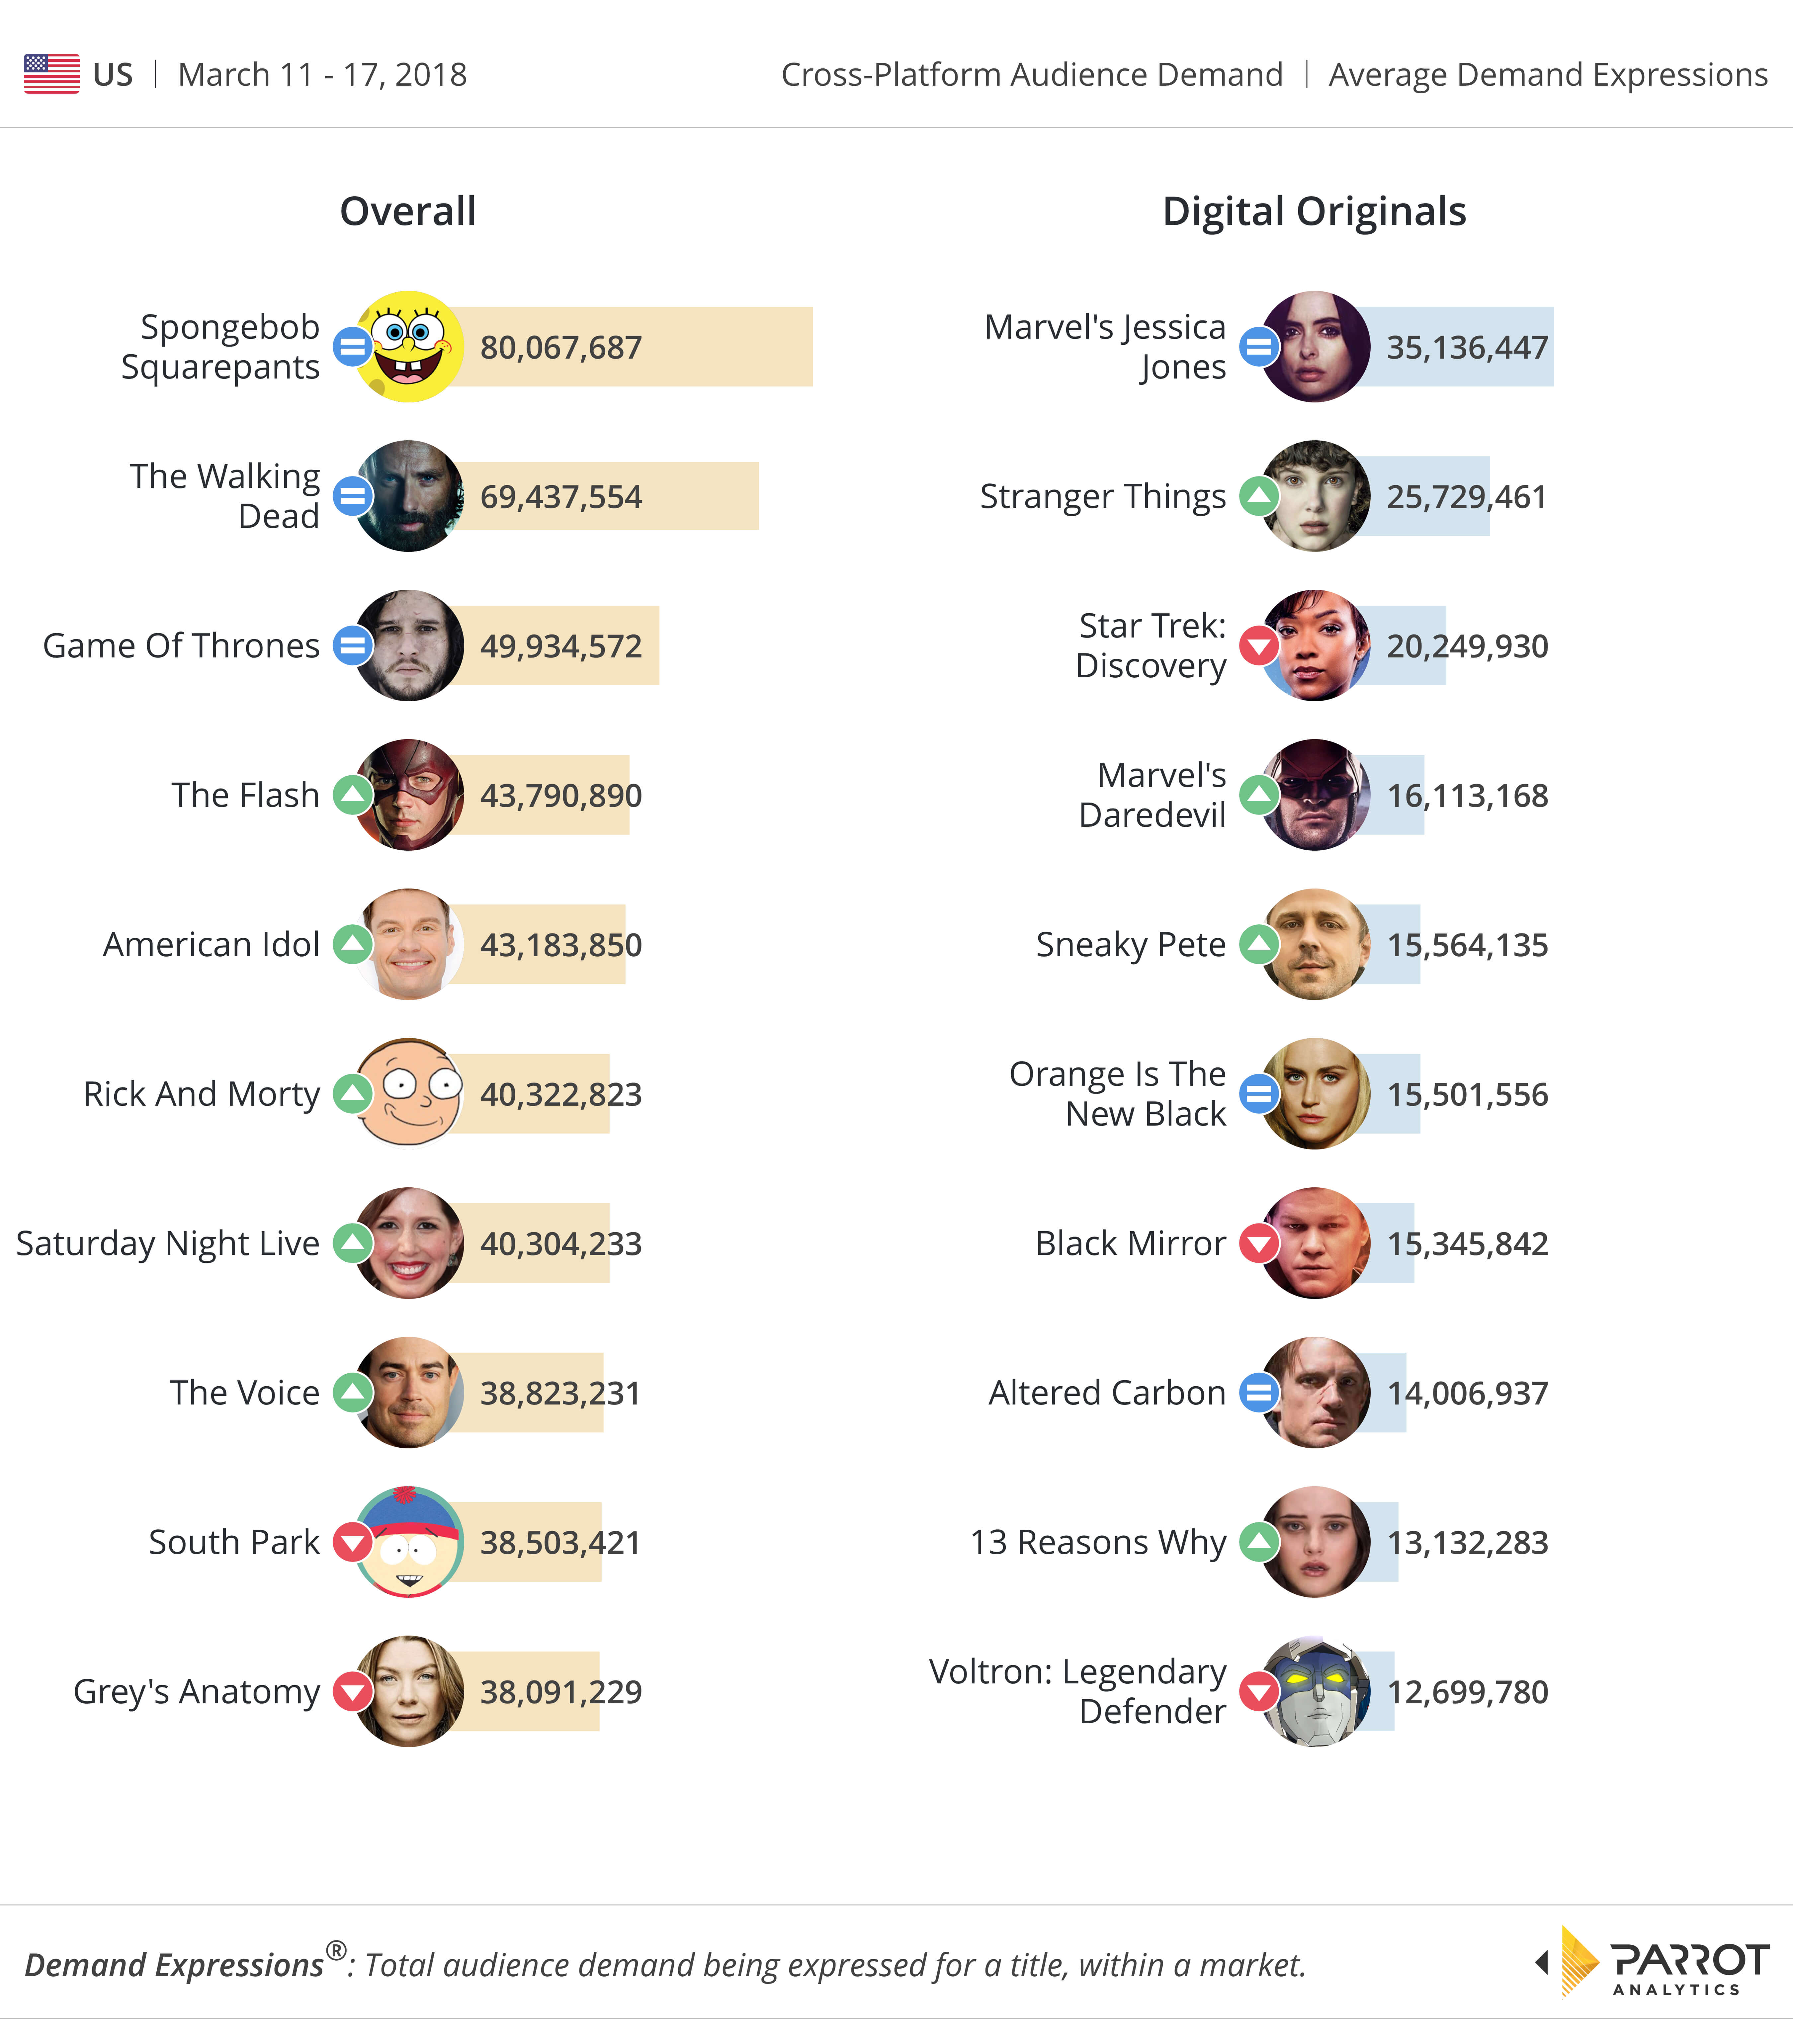
This week, only one Amazon series is ranked in our latest chart. We suspect its unlikely to have any traction against the tide of Netflix Digital Original Series. The launch of the second season of Sneaky Pete (ranked #5) on March 9 is the only returning show on the chart this week. The crime drama has roughly 10% more demand compared to Netflix’s dormant titles like Orange is the New Black, 13 Reasons Why, Black Mirror and Altered Carbon. Sneaky Pete also has the highest demand rise in contrast to the prior week.
In the documents cited by Reuters, the first season of the David Shore-produced drama Sneaky Pete cost $93 million. In contrast, the veteran medical drama House on Fox, which was Mr. Shore’s last hit on a linear network, reportedly cost $5 million an episode in 2012. Also, three days after launch, Marvel’s Jessica Jones still dominates the chart with 1.3 times more demand compared to the second-ranked title.
ABC’s American Idol roars back in the overall chart as the fifth most in-demand title this week. The new cycle of the competition reality show has 11% more demand compared to NBC’s The Voice. Elsewhere NBC’s Saturday Night Live (ranked #7) experienced a surge in popularity compared to other scripted titles.


