Parrot Analytics provides a wealth of data that can be leveraged to provide truly data-driven decisions for every step along the TV production and content supply chain. From understanding potential investment opportunities to commissioning new titles, through to the sale of established properties, Parrot Analytics’ unique and proprietary Content Genome enables deep and global TV demand analysis, anchored by essential content factors, that can affect the probability of audience success, and subsequent profitability, of a new TV show.
Before we get started with this article, let’s establish clearly what we mean by “global TV demand”. In this recent Cablefax editorial, Parrot Analytics’ CEO Wared Seger notes: “So, how do we unequivocally say what is popular? It was this question that inspired an industry-wide movement away from the panel- and survey-based measurement systems it had become reliant upon and into a concerted effort to adopt a much more empirical and holistic approach to understand consumer demand for content across platforms.”
Parrot Analytics has established the industry standard for global TV demand measurement, across all devices and platforms, in almost every country in the world. Through our data science capabilities we are able to generate value-adding insights, relying on this industry-leading global TV demand data.
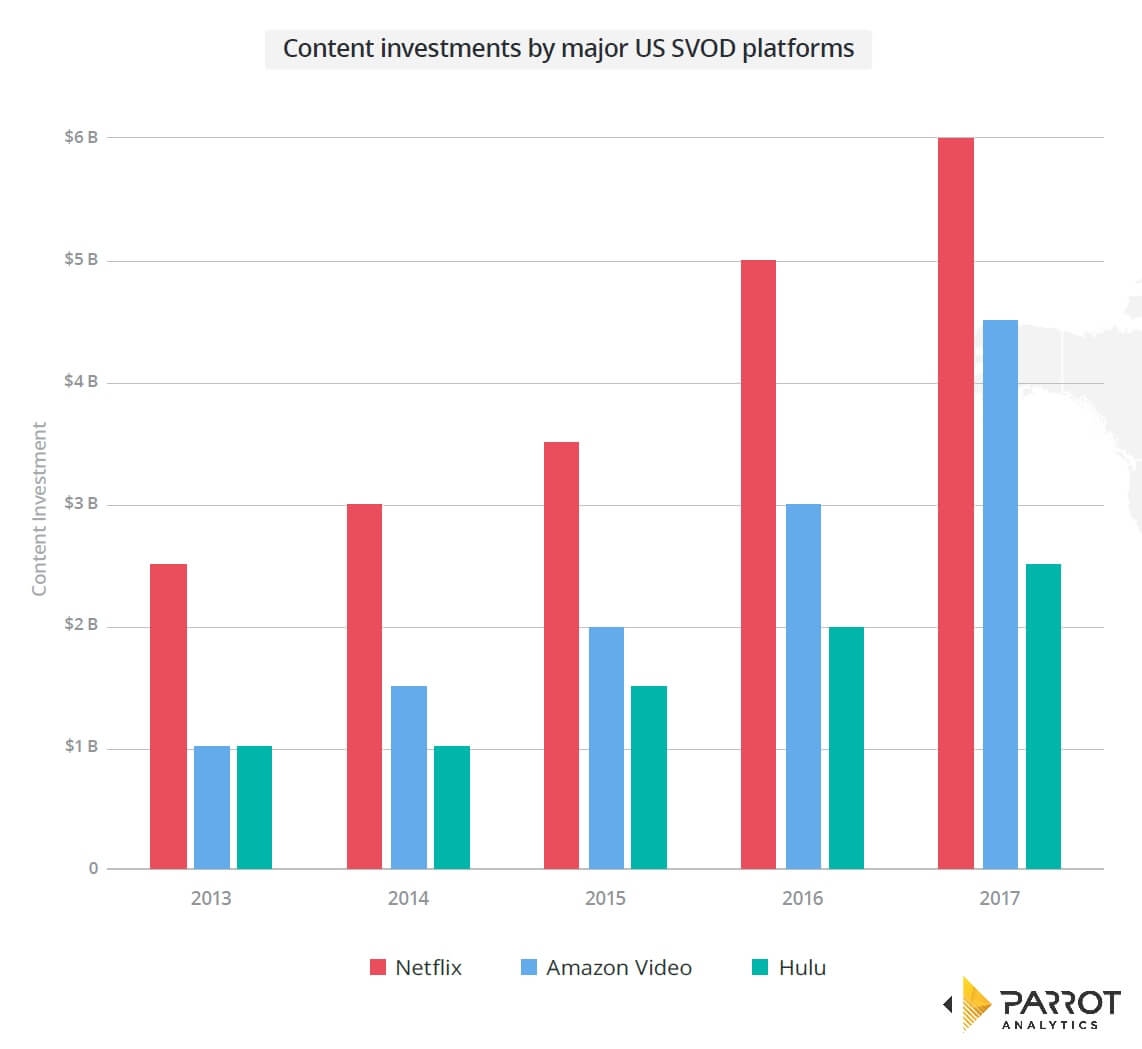
With the explosion of premium content, produced in the context of new business models, internationalization strategies and a plethora of new distribution, marketing, monetization and platform options it is critical that data takes a seat at the production and commissioning table. As just one example, consider the accelerated investment from Netflix, Amazon and Hulu:
Which now doubt is responsible for the increase in new subscribers joining these platforms:
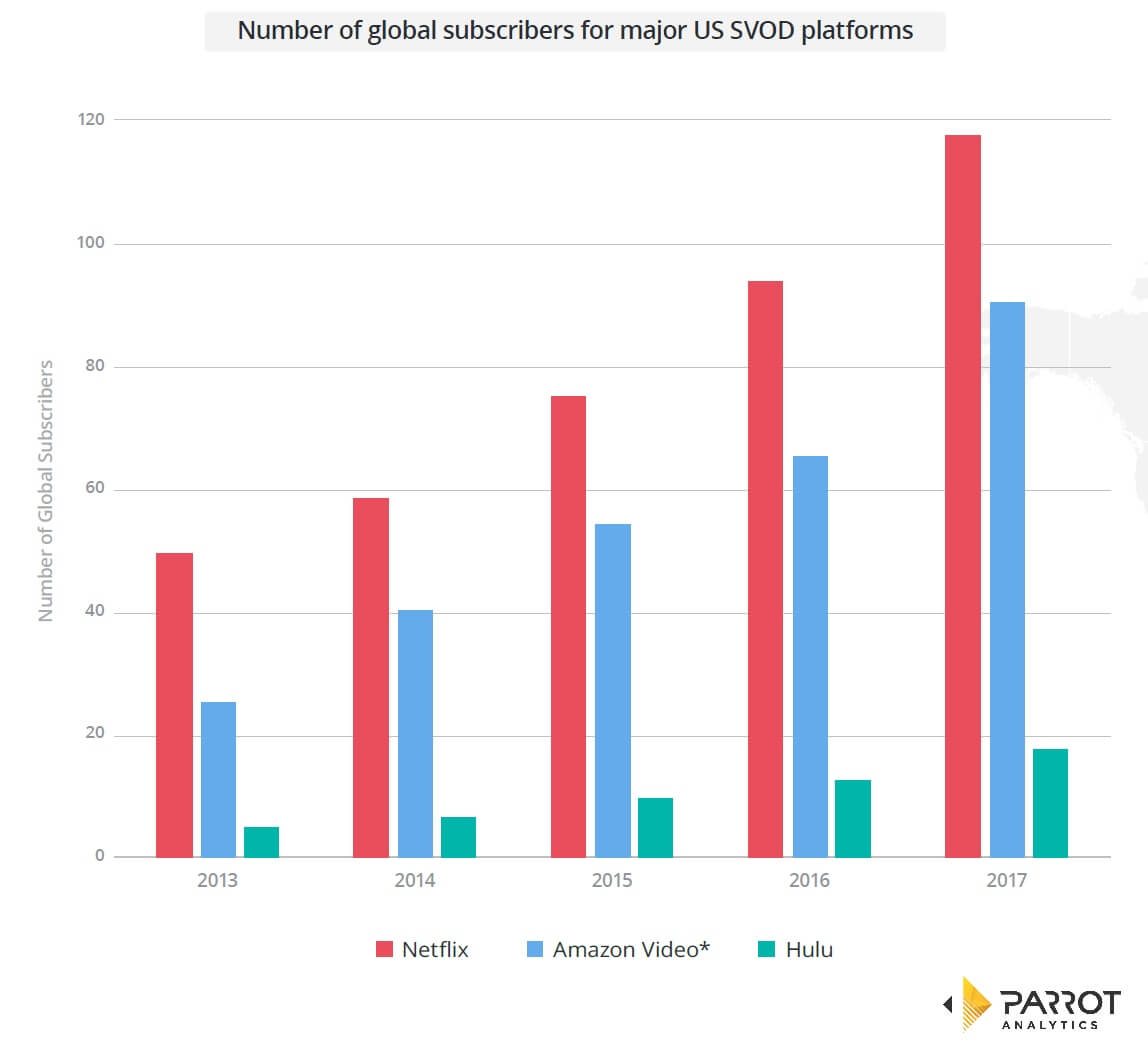
Incidentally, there is also a correlation between Netflix’s digital originals and its rising share price, per our analysis for Quartz). For more global analysis and insights, make sure you download our Global Television Demand Report.
Let us now take a brief tour through some of the applications of the Content Genome dataset, to showcase its power to answer the crucial business questions affecting content investment and production, and beyond.
Analysis by location: Country, region and global
Many TV industry challenges are related to not having enough information to accurately assess how content will perform when it is launched, or when the aim is to launch it in a new market. Fortunately, data-driven decisions can now be made by using the location-related aspects of Parrot Analytics’ Content Genome.
These variables can identify the solution to business questions around licensing, production investment and more. Several previously published studies that highlight how demand data can answer questions related to location are summarized in this section. We will use individual use case that each demonstrate the unique properties of our global TV demand data and content genome.
Use Case 1: TV measurement in Australia: Market investigation of top titles, genres, networks and platforms
In this study, Parrot Analytics performed an in-depth investigation of trends in a single market, focusing on which subgenres are in high demand and how the demand for them is evolving. Our analysis also examines how the demand for the output of the top Australian networks compares to Netflix and Amazon to provide detail on how big, as measured by demand data, the international streaming platforms are in this market.
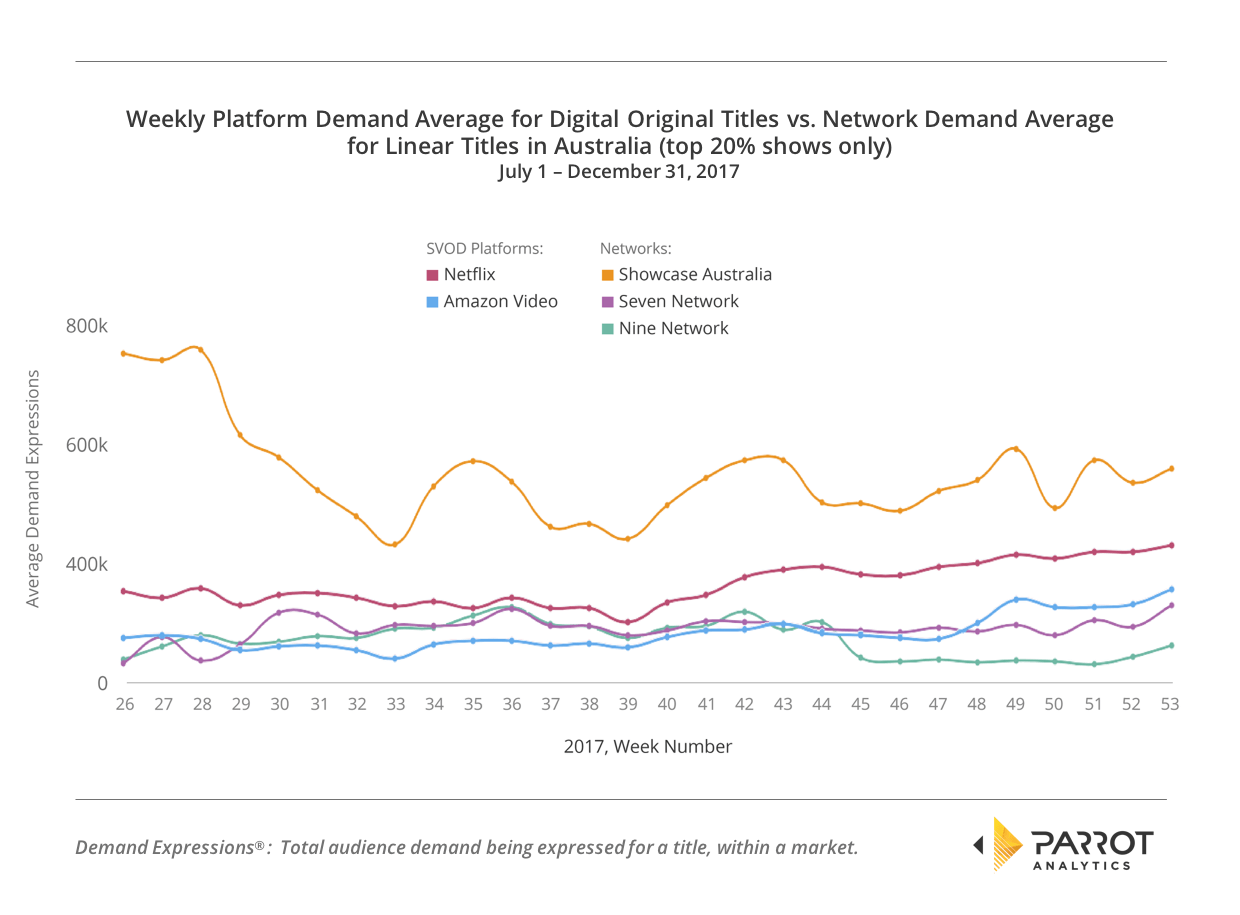
This sort of analysis gives a high-level overview of the important trends in the market such as the rise of the popularity of streaming, facilitating strategic decision-making.
Use Case 2: Regional differences in TV content popularity for Argentinian, Colombian, Mexican and US Hispanic audiences
Similarly, in this report first published in separate articles by ttvnews and Prensario, we provide an in-depth investigation of trends across an entire region, focusing on some key markets and their similarities and differences to each other and the regional average. As just one example of many contained in our in-depth investigation, the below graph details how much Mexican demand there is compared to the average for the most in-demand subgenres in Latin America.

This gives a high-level overview of the major trends for the most important type of content across the region, facilitating strategic decision-making for all businesses engaged in the TV industry in Latin America, specifically investment and production-related decisions.
Use Case 3: The 20 most popular shows in the world right now
Finally, in this report published by Inverse is a simple ranking of the shows that have the most demand around the whole world. It’s an example of how all the previous analyses can be applied on a global scale, as is required in an industry where content itself is becoming increasingly global.
Analysis by industry segment: Networks, platforms, channels, studios and more
One of the most powerful Content Genome categories are those relating to the content’s origin. Parrot Analytics tracks a number of variables related to this including the title’s production companies, whether it was part of a partnership across countries and the original network/platform it appeared on.
These genome values allow analysis that answers business questions around partnerships, licensing and distribution, such as which streaming platforms are considered best value by consumers, which US network’s shows appeal most to a specific overseas audience and which studio’s productions fit best with the audience of a particular broadcast channel in a market.
Some examples of previously published analysis in this category are summarized below:
Use Case 4: Does Hulu’s rapid growth spell trouble for Netflix and Amazon?
A recent New York Observer report investigated the relative strengths of the catalogs of the three biggest US OTT platforms. By comparing the average demand for the full US catalogs, the services were able to be rated by the appeal they held to the average US viewer. The report also compared recently released Hulu subscriber numbers with demand for Hulu original series, illustrating in one graph both key aspects of the service’s strong US growth.
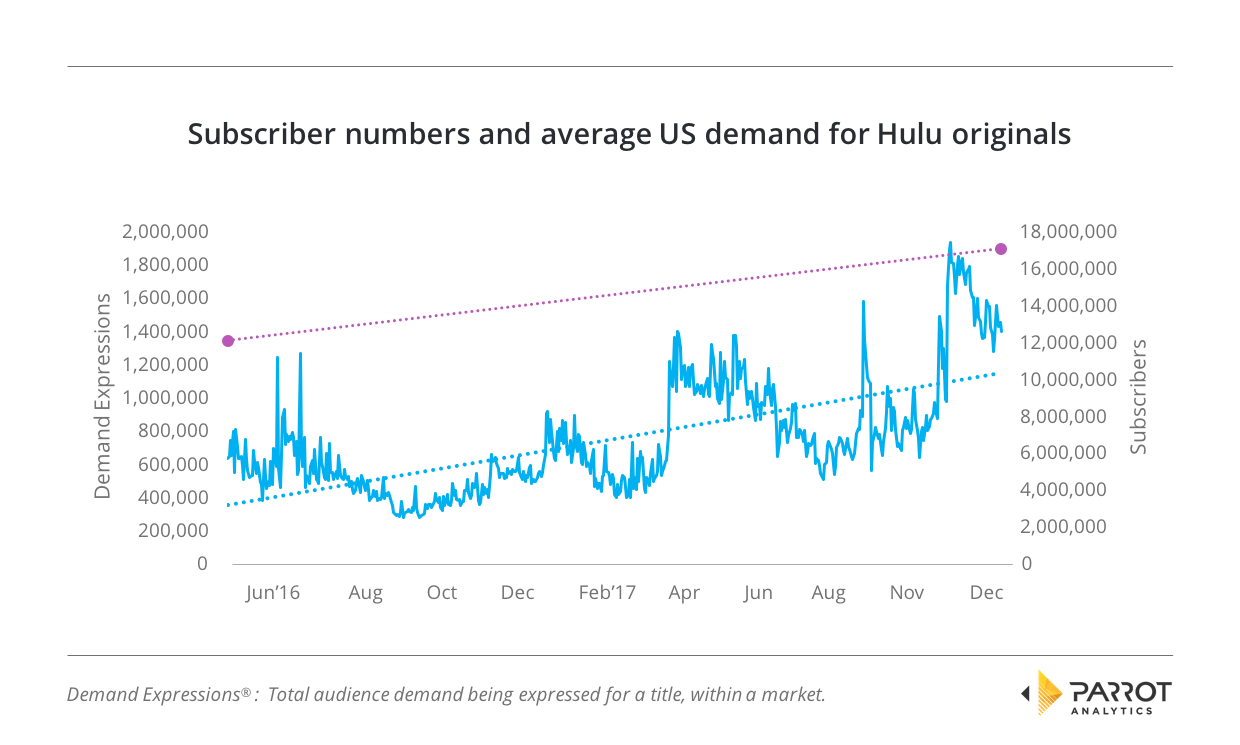
This gave analysts and investors a fuller picture of the domestic performance of the Hulu service, as well as demonstrating the relative value to American consumers of each streaming service.
Use Case 5: How Disney’s streaming dreams and nightmares over the Silicon Valley invasion drove Fox deal
As reported by Deadline, late 2017 brought the news that Disney is buying 21st Century Fox. Given Disney’s stated OTT ambitions, it seems almost certain that Netflix deals for FOX content will not be renewed. To determine the impact on Netflix, this report used global TV demand data to assess the value of FOX’s catalog to the streamer. It showed that the FOX catalog had double the appeal of Netflix’s US catalog in general, meaning the loss of FOX content from the platform would likely have a strong impact.

We further showed that Netflix would have to take pre-emptive steps to cover the impending content gap, which Netflix responded to by increasing spending on original content.
Use Case 6: Traditional US networks top Europe demand
In this report by TBI Vision, Parrot Analytics examined which US studios produced the type of content that is most in-demand in Europe. By comparing the share of European demand attained by each studio, the US studios that produced content that best suited that region of the world could then be identified.
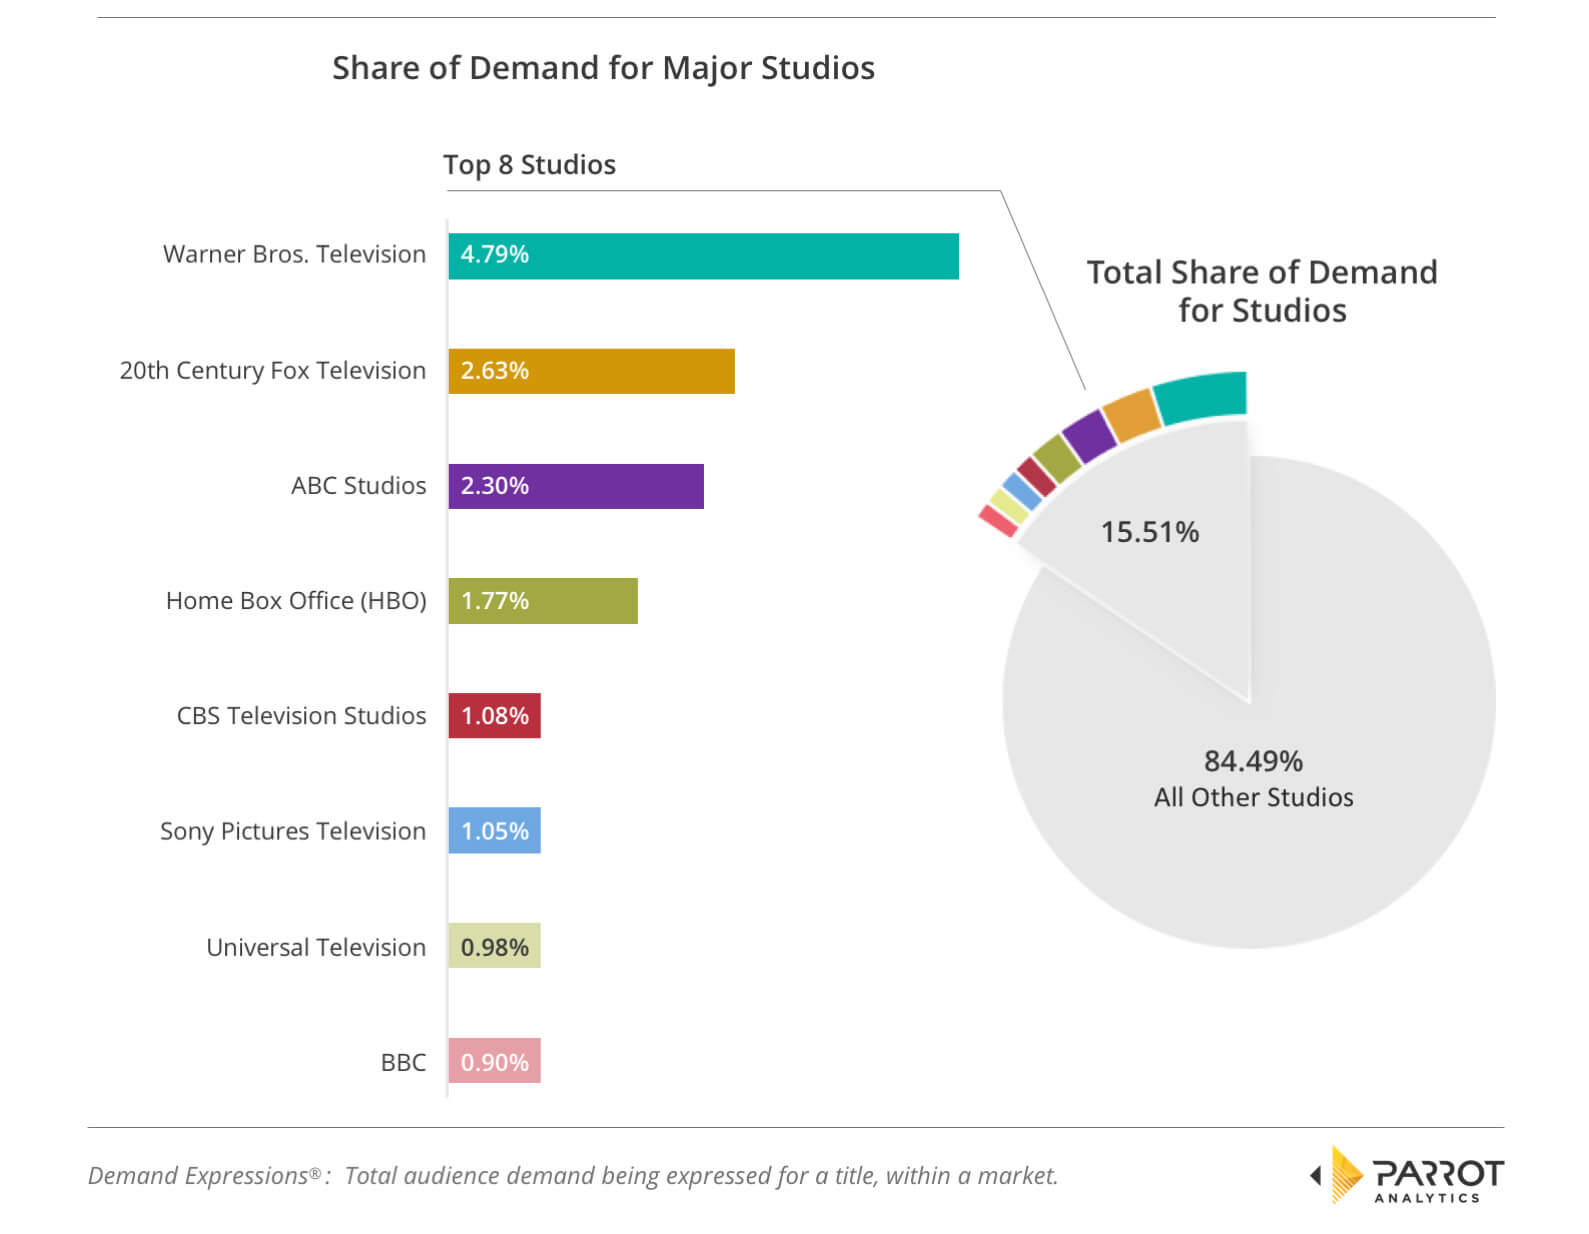
This type of analysis aids distributors looking to sign content deals; given two similar portfolios from different studios or networks, the likely best fit for a region or specific country can be found.
Analysis by content factors: Cast, crew, adaptations and more
Clearly, each TV industry market player will have their own strategic priorities and content-related decisions they deem most important. Production companies for example will want to attract the best talent that will maximize viewers, networks need to be able to pick showrunners and directors that will deliver results while scriptwriters want to know what type of media makes the best TV adaptations – even before they start.
Parrot Analytics can compare portfolios of shows based on any shared content factor, either from the Content Genome or from any other external metric. Some examples of previously published studies that have focused on specific content factors are listed next.
Use Case 7: Why Germany won’t ever hassle The Hoff
Our study published by MIP Trends investigated the appeal of specific actors in a country, in this example American actor David Hasselhoff’s enduring popularity in Germany.
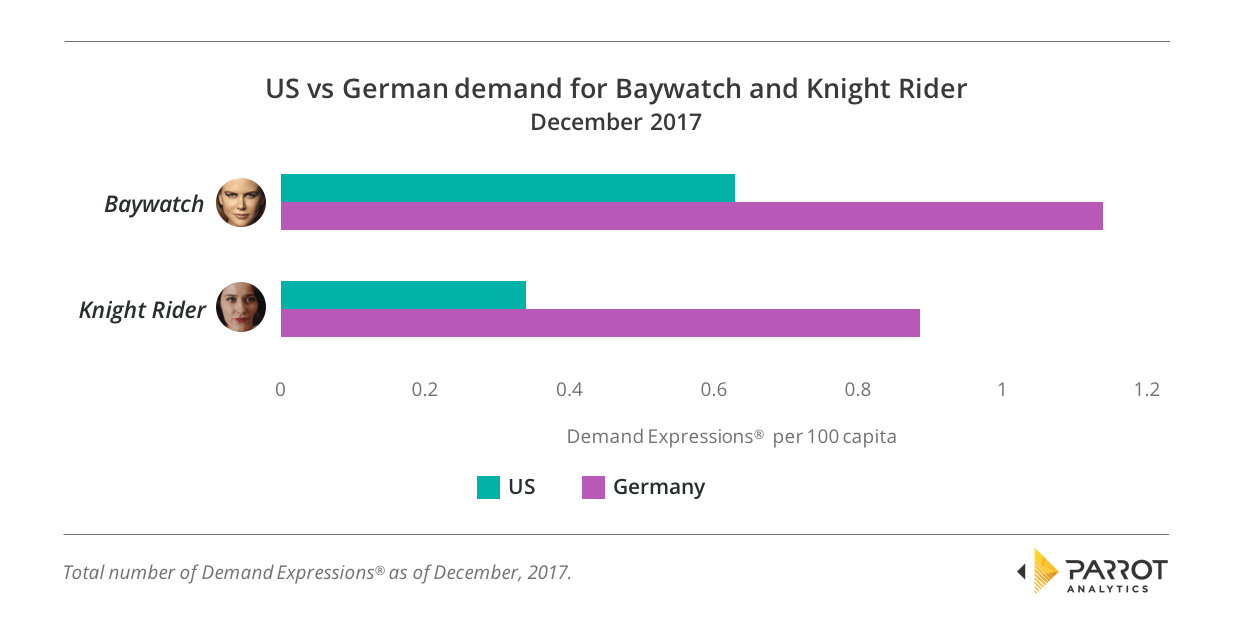
Analysis of which actor’s titles have higher average demand can aide casting decisions, for example, revealing which actor would be the better choice to appeal to a specific demographic.
Use Case 8: Who were America’s most in-demand TV showrunners in 2017?
In this analysis published by Deadline, Parrot Analytics investigated the portfolios of selected veteran comedy and drama showrunners to determine who had the highest average American demand in 2017. Interestingly, since the time this article was published in Deadline, Ryan Murphy was poached from FOX by Netflix in a record-breaking $300 million deal.
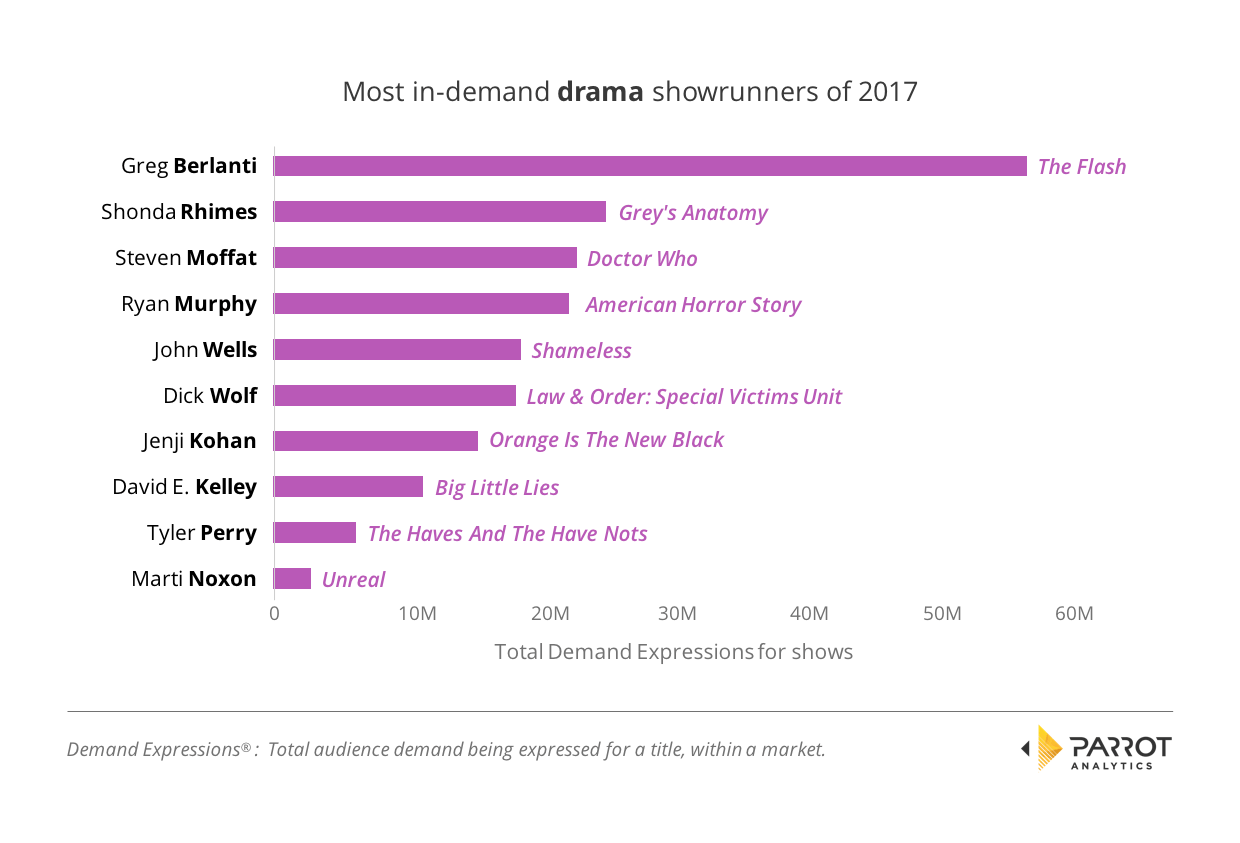
A Parrot Analytics portfolio analysis of the output of the industry’s creatives can reveal who really knows how to appeal to broad audiences, who is better for niche appeal and overall which big-name creators bring commensurate value to the table – as measured by the all-important factor of audience demand for their content.
Use Case 9: What type of media adaptation leads to the best TV?
In this report, we investigated the type of source material behind adapted shows for the 100 highest in-demand titles in three countries around the world.
In doing so, Parrot Analytics discovered that most of the top shows were actually original to TV. Of the adapted titles, generally the best performing were those that were based on comic books, and interestingly almost all adaptations performed better than original properties.
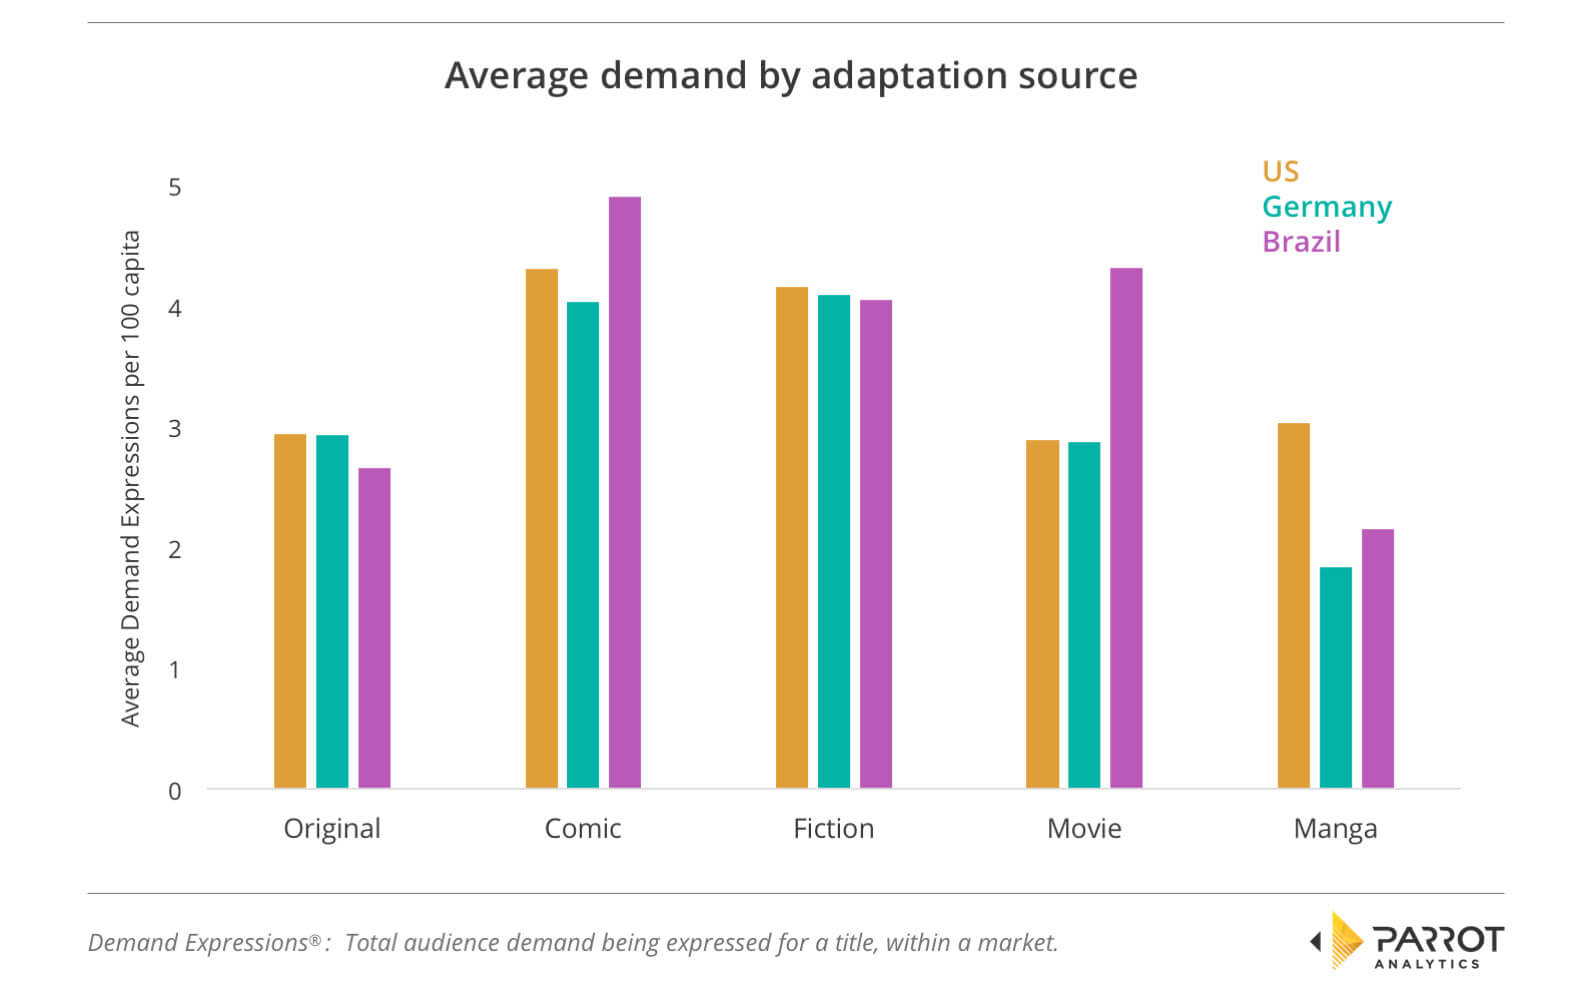
This study therefore quantified the value of paying for the rights to adapt an already existing property, against the risk of making something new – no doubt a very valuable data point when considering an entertainment investment or a production.
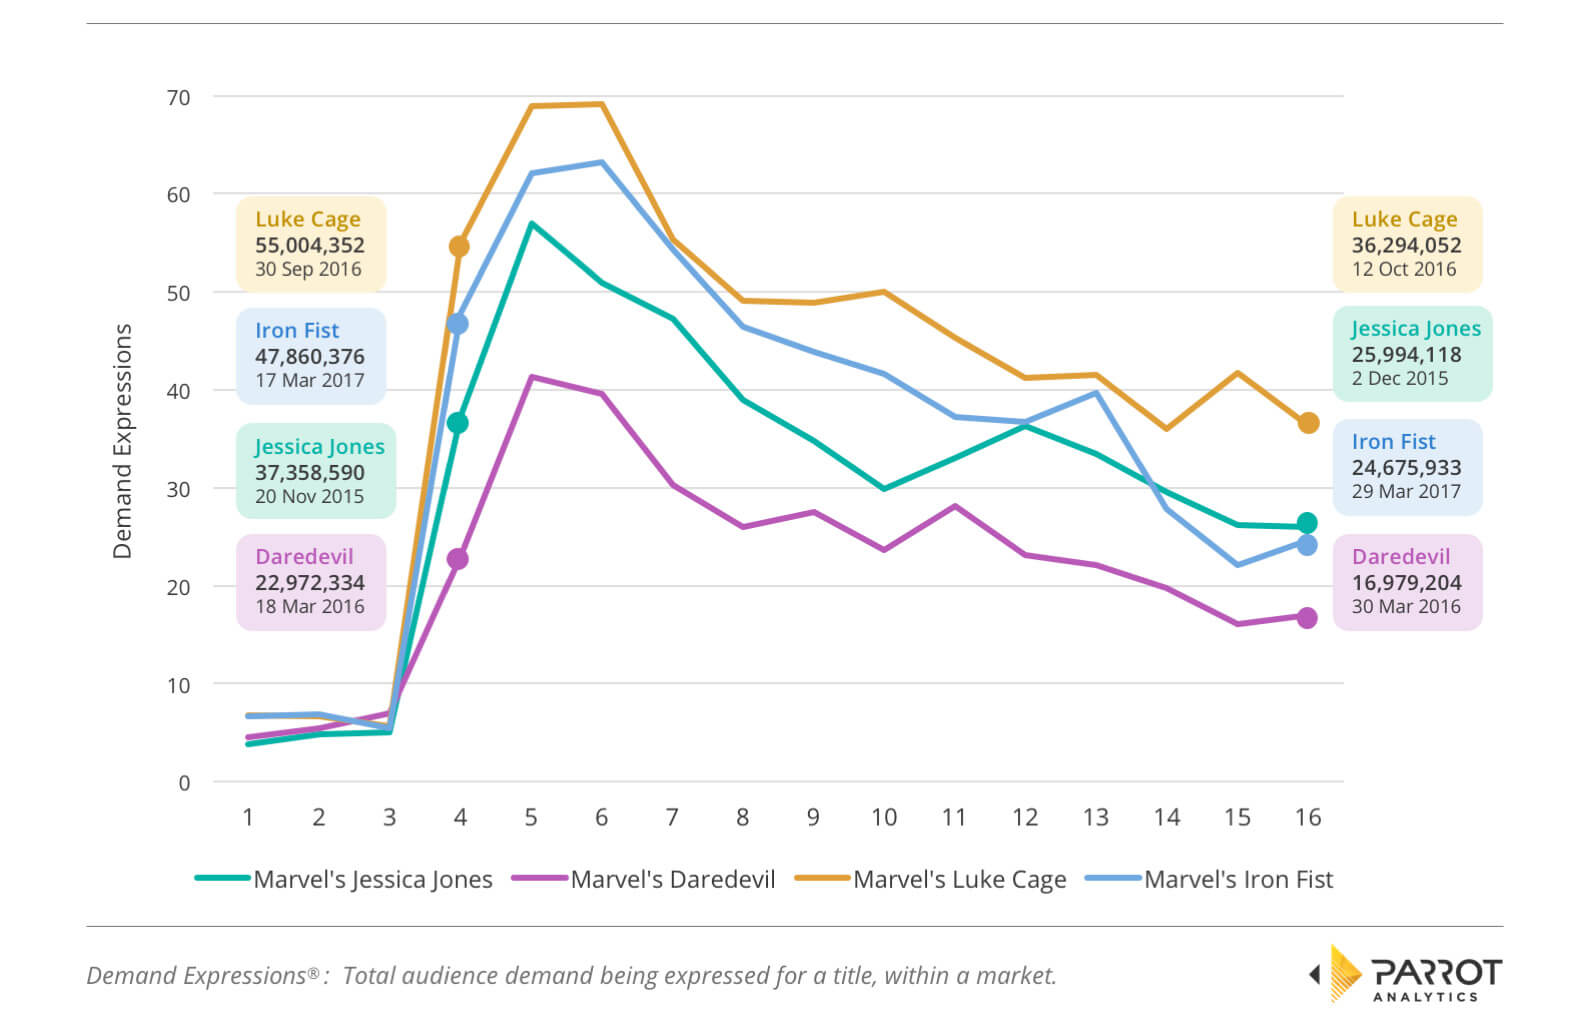
Use Case 10: Title-specific investigation vs Comps e.g. Netflix’s Iron Fist
Post-release analysis of a title’s performance relative to the premieres of comparable series can reveal early if it is a hit or a flop. In this analysis published by Insider, we compared the release of Iron Fist (then Netflix’s newest Marvel title) to the previous Marvel releases.
Quick analysis of show performance allows networks airing weekly shows to salvage underperforming titles by applying additional Parrot Analytics data and making subsequent changes in programming.
Alternative courses of action include boosting awareness of the series airing via marketing targeted at the show’s best demographics. Further analysis can determine which aspects of the series are most and least popular with audiences and later episodes potentially be reworked/adapted to emphasize the aspects of the show that resonate the best.
The example use cases in each category only scratch the very surface of the unparalleled industry decision power that rests in Parrot Analytics’ global TV demand data, powered by our content genome. Please reach out to us to discuss your specific needs.