The 2018 nominations marked the first time in 17 years that HBO was not the most nominated network. That honor instead went to streaming platform Netflix which received 112 nominations, although HBO was a close second with 108.
Netflix had the following to say in their latest letter to shareholders:
“We were honored last week with the most Emmy nominations of any network. The 112 Netflix nominations include five best series and best limited series nominations and are spread across 40 different scripted and unscripted series, TV movies, limited series, documentaries, talk shows, comedy specials and series for kids. This is a testament to the fantastic creators we work with across all forms of television.”
Recognition by prestigious awards like the Emmys is an important tool for networks to attract top talent. Netflix’ nominations total therefore is an interesting development for the streaming company, now able to continue to lure talented screenwriters, directors and producers such as Shonda Rimes and Ryan Murpy with unparalleled award prestige.
However, does this recognition for Netflix in the Emmy nominations reflect the content that American audiences actually care about?
In this analysis we will leverage Parrot Analytics’ global TV demand data to investigate U.S. audience network demand, and compare this to the number of Emmy nominations received per network, to see if the hype is justified.
Methodology
To ensure we are able to work with sufficient data to arrive at a meaningful result, we have restricted this analysis to networks and platforms that received 15 or more Primetime Emmy nominations for a TV series (this only excludes the dozen or so nominations for TV movies, as the vast majority of Primetime Emmy nominations relate to a TV show).
11 networks thus fell into this “highly-nominated” category. In order of most nominations, the companies we have included in our evaluation, are: Netflix, HBO, NBC, FX, CBS, ABC, Hulu, Amazon, Showtime, National Geographic and FOX.
Knowing which networks are highly nominated for the 70th Primetime Emmy Awards, we were then able to determine how much demand each network has for all of their original TV titles in the U.S., not just the ones nominated. By including all original titles from a network in our analysis allowed us to compare the overall popularity of the networks with the actual share of the nominations they have received (out of all nominations for the 11 highly nominated networks).
Finally, to calculate the popularity, we took the average U.S. audience demand for each show on a particular network over the Emmy eligibility period of 1st June 2017 to 31st May 2018; this allowed us to determine the demand share of these 11 networks, and compare this share of popularity to the share of nominations for the 11 networks.
Analysis
Our analysis reveals that this year’s Emmys are potentially over-valuing Netflix shows. According to our investigation, HBO actually comes out on top when U.S. network demand is correlated with the number of nominations received. Furthermore, the Emmys are under-valuing the U.S. audience demand that exists for networks such as FOX, ABC and CBS compared to the few nominations received.
The below chart presents the summary of our investigation:
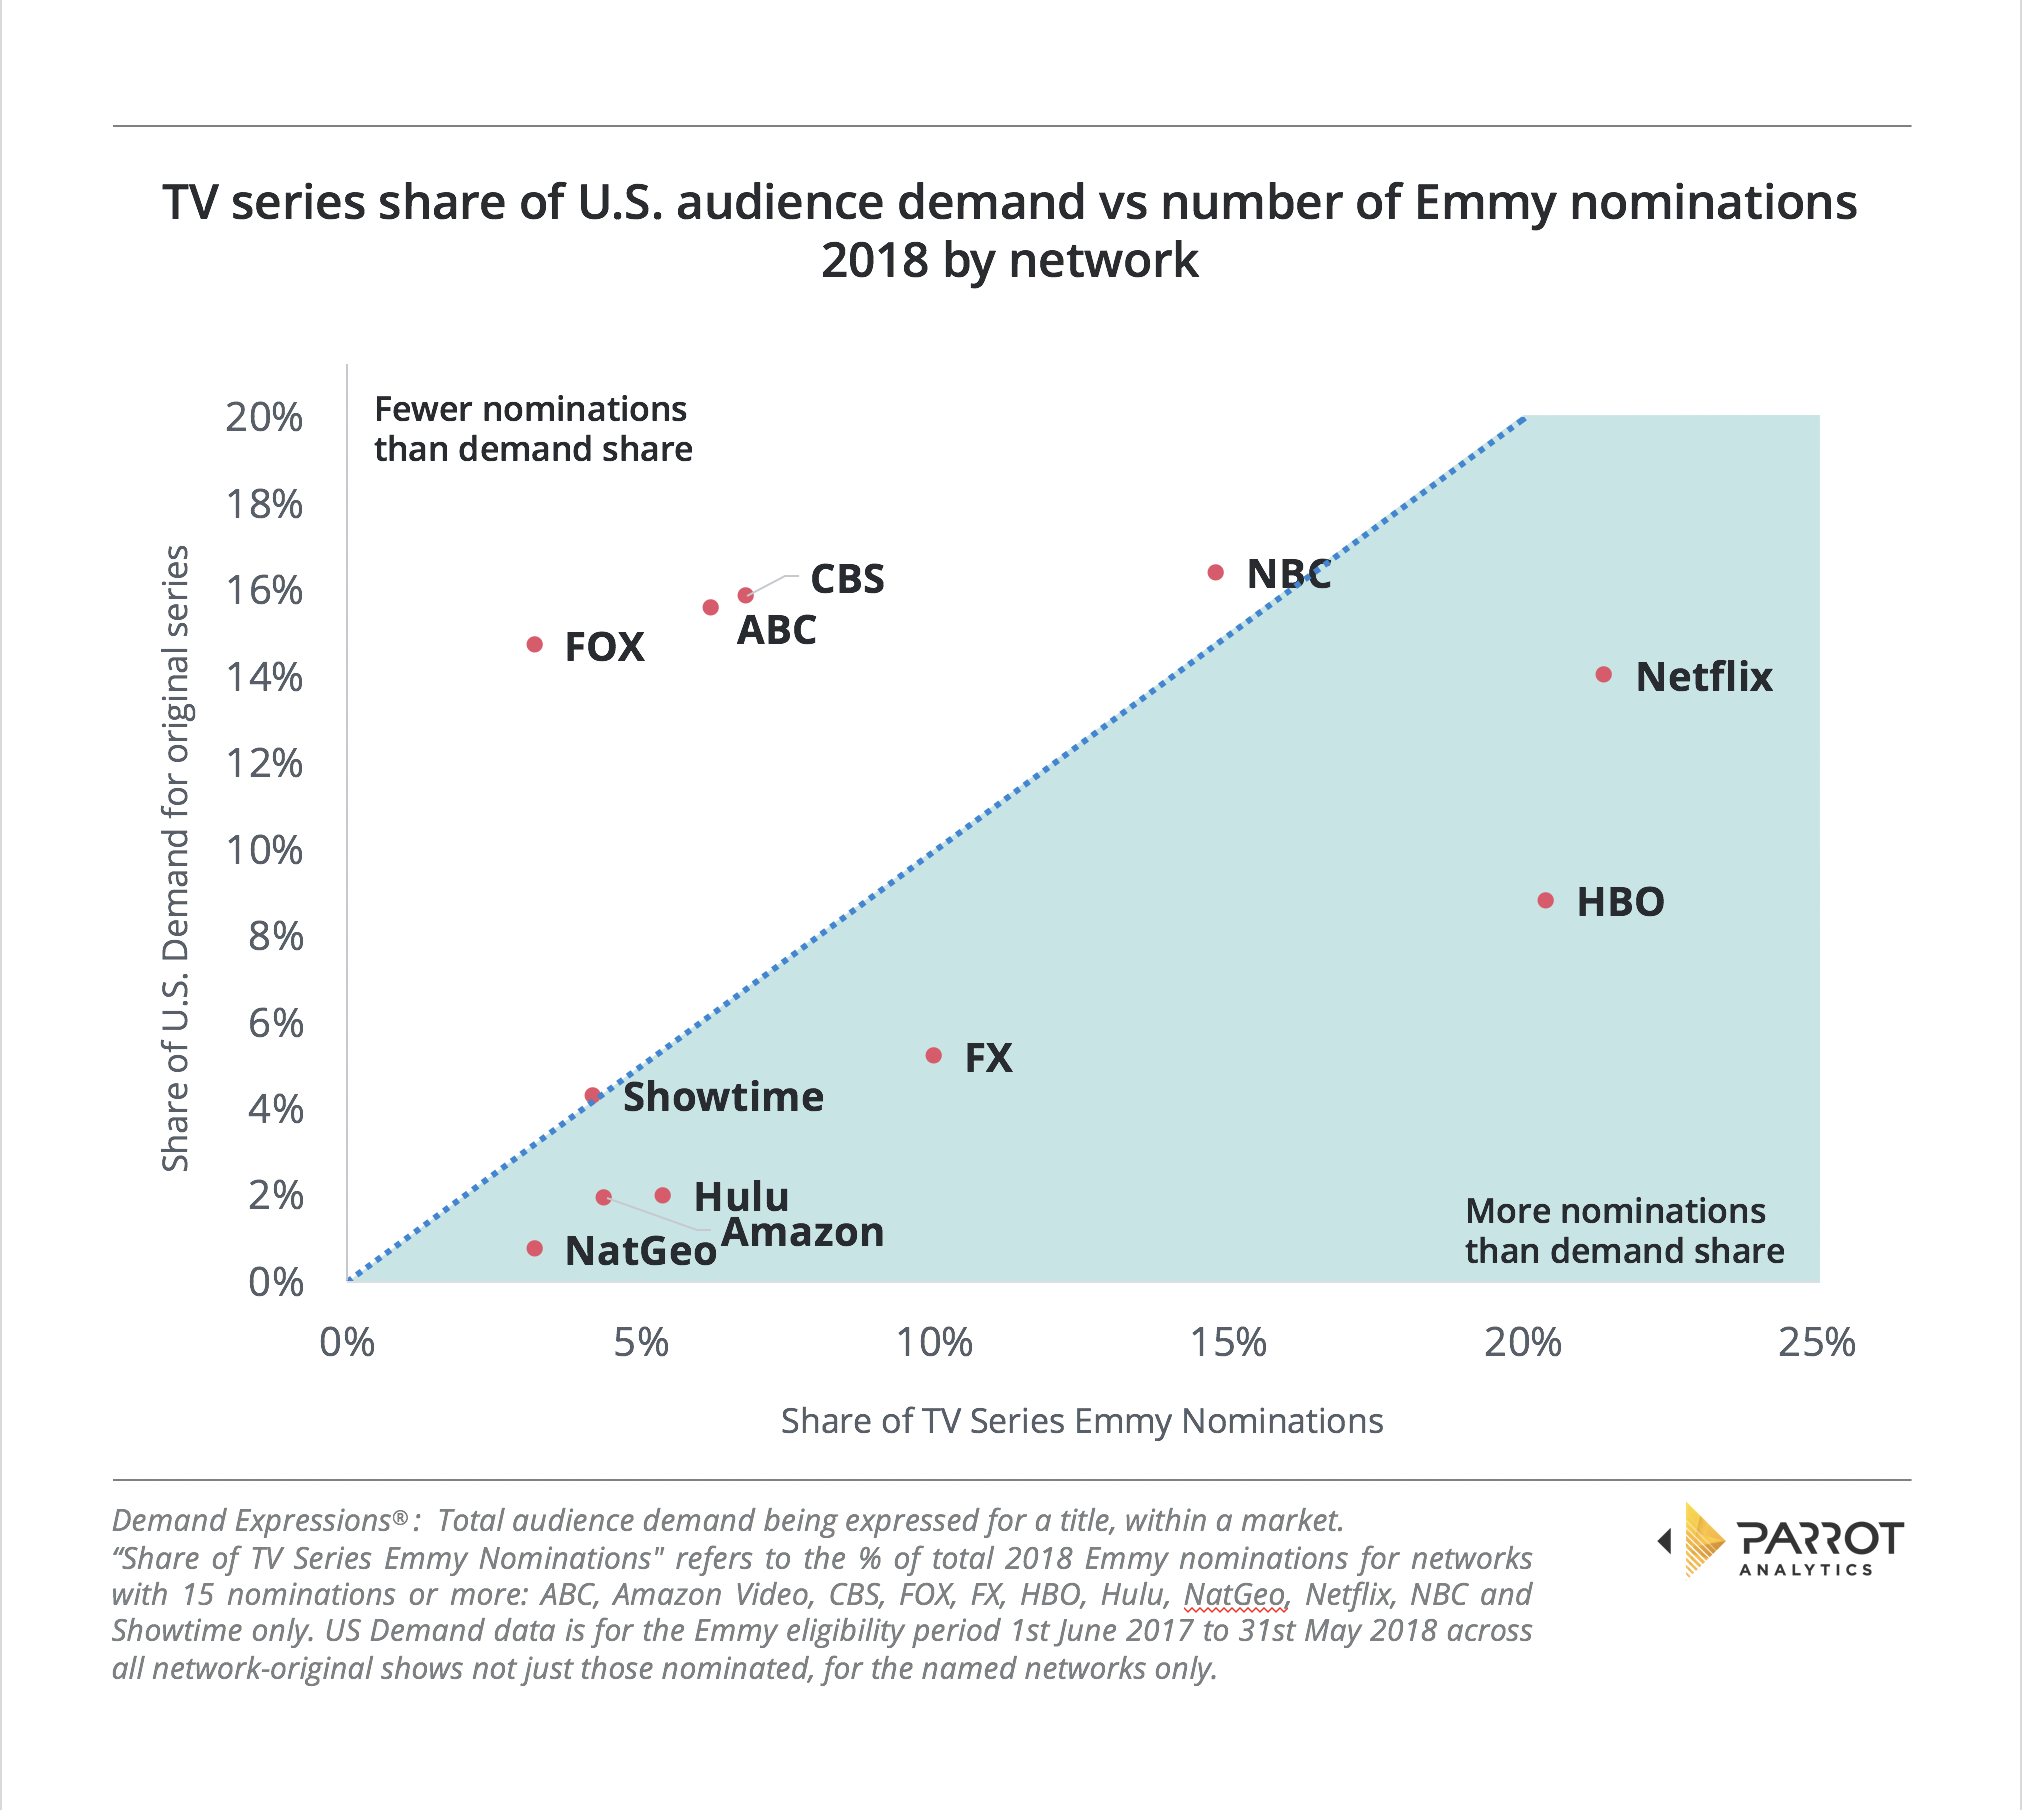
The blue line marks where a network would be if the network’s demand share and nomination share are the same. With 4.3% of the US demand from of the 11 networks and 4.2% of the Emmy nominations, Showtime is performing almost exactly as would be expected if the Emmys nominations were based solely on U.S. audience popularity.
However, popularity is not the criteria that decides how nominations are given out, these are instead given out for artistic merit and talent. And yet by taking a measure of popularity instead, HBO is still the top-performing network, with an 8.9% U.S. demand share and a huge 20.4% Emmy nomination share, which equates to a difference of +11.5% (over-performing).
Although Netflix has a bigger share of nominations at 21.4%, the mass-market streamer also has a larger U.S. demand share of 14.1%, giving it “only” an over-performance of 7.3% when we compare all their original shows’ share of popularity vs the share of nominations.
None of the other over-performing networks come close to these numbers, although FX in third has a very respectable difference of 4.8% between its U.S. demand and nomination share. Continuing, Hulu achieved 3.4% while both Amazon Video and National Geographic over-performed by 2.4%.
While of course the networks that over-performed should be applauded for the effort it takes to punch above their weight like this, there is a common factor in the networks to the left of the blue dotted line: All of the networks that are substantially under-performing in their nomination share against their audience demand share are broadcast networks.
NBC has 1.6% fewer awards than would be expected by popularity, CBS has 9.1% fewer, ABC 9.4% and FOX 11.6%. Further, our evaluation did not even include the fifth broadcast network The CW, as despite the airing of critically acclaimed shows like Jane The Virgin and Crazy Ex-Girlfriend, that network did not achieve our evaluation threshold of 15 nominations.
Conclusions
Our analysis demonstrates that there is a large data spread that exists when network/platform popularity is correlated with the number of nominations received.
On the one hand, Netflix should have received even more nominations given the popularity of their original shows. And in turn, this means that HBO is actually the #1 best-performing network overall, with 11.5% more nominations received than what would have been expected, based on their average U.S. platform demand over the Emmys eligibility period.
And on the other hand, our findings show that the Television Academy does not appear to be recognizing the US broadcast networks FOX, ABC and CBS as much as would be expected, given the high level of U.S. audience share these networks command with their original content.
For more information about trends in Emmy nominations series, reach out to Parrot Analytics for a live demonstration our Demand Portal, or watch our latest product video.