Parrot Analytics has established the industry standard for global TV demand measurement, across all devices and platforms, in almost every country in the world. Through our data science capabilities we are able to generate value-adding TV insights for SVOD platforms, by relying on this industry-leading global TV demand data.
The Global Television Demand Report leverages worldwide demand data for streaming originals from Netflix, Amazon Prime Video, Hulu, CBS All Access, as well as local SVOD platforms and is published quarterly by Parrot Analytics; the report utilizes the full global TV analytics dataset, which is comprised of 3.5 trillion data points across 100+ languages in 100+ countries.
The global market share of SVOD platforms
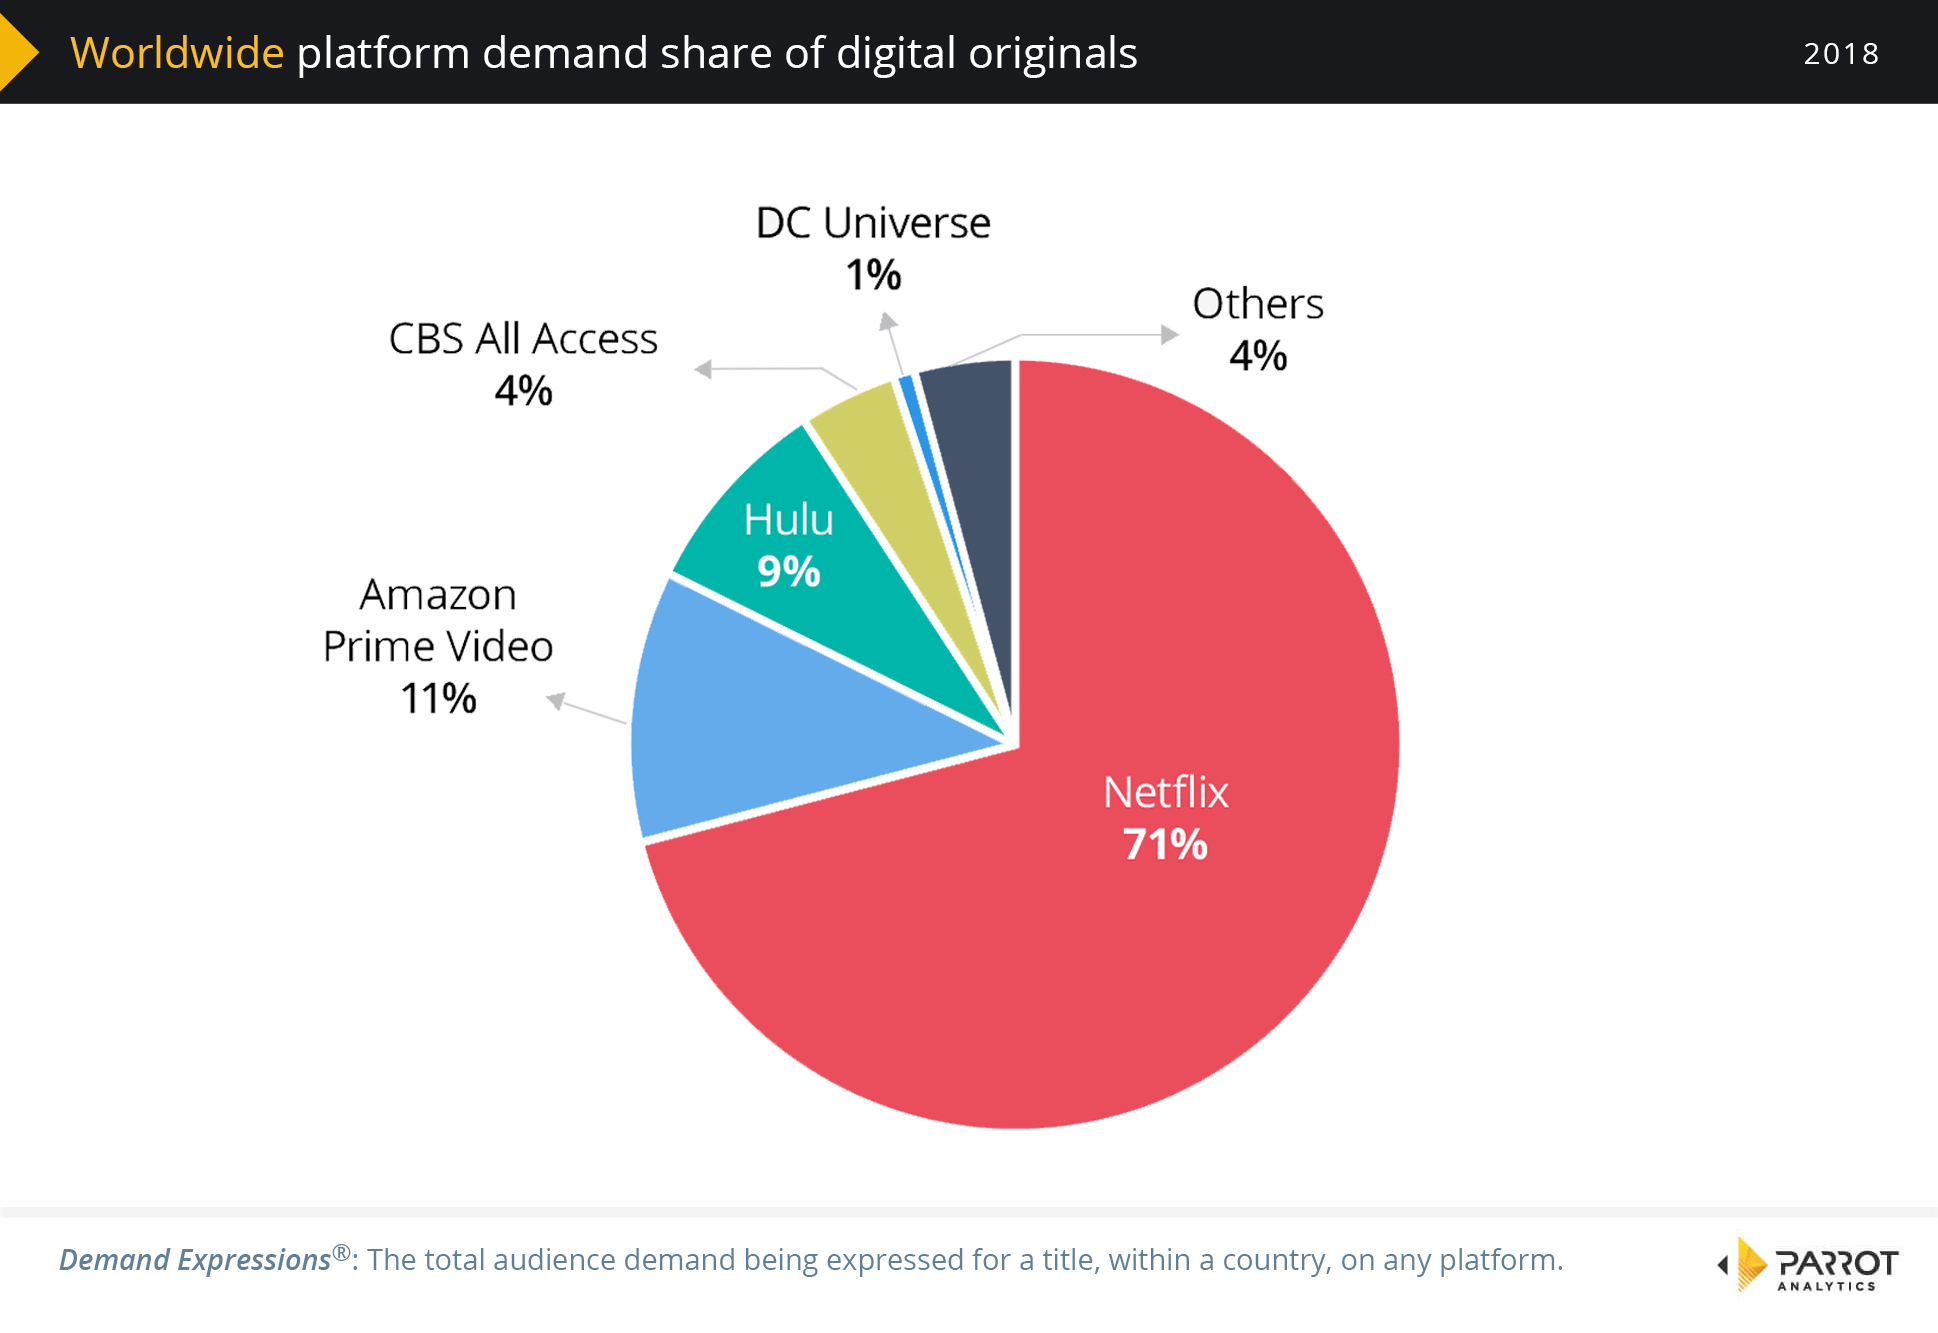
We define the global SVOD market share as the share of demand for each platform’s digital originals, as registered by our global TV demand measurement system, which is active in 100+ markets. Based on this approach, we are able to make the following observations:
- Globally, by far the most demand was expressed for digital original series from Netflix.
- In 2018, 71% of all global demand for digital original titles was for Netflix series.
- 11% of all global demand was for original titles from Amazon Prime Video and 9% for Hulu Originals.
The global market share of SVOD drama originals
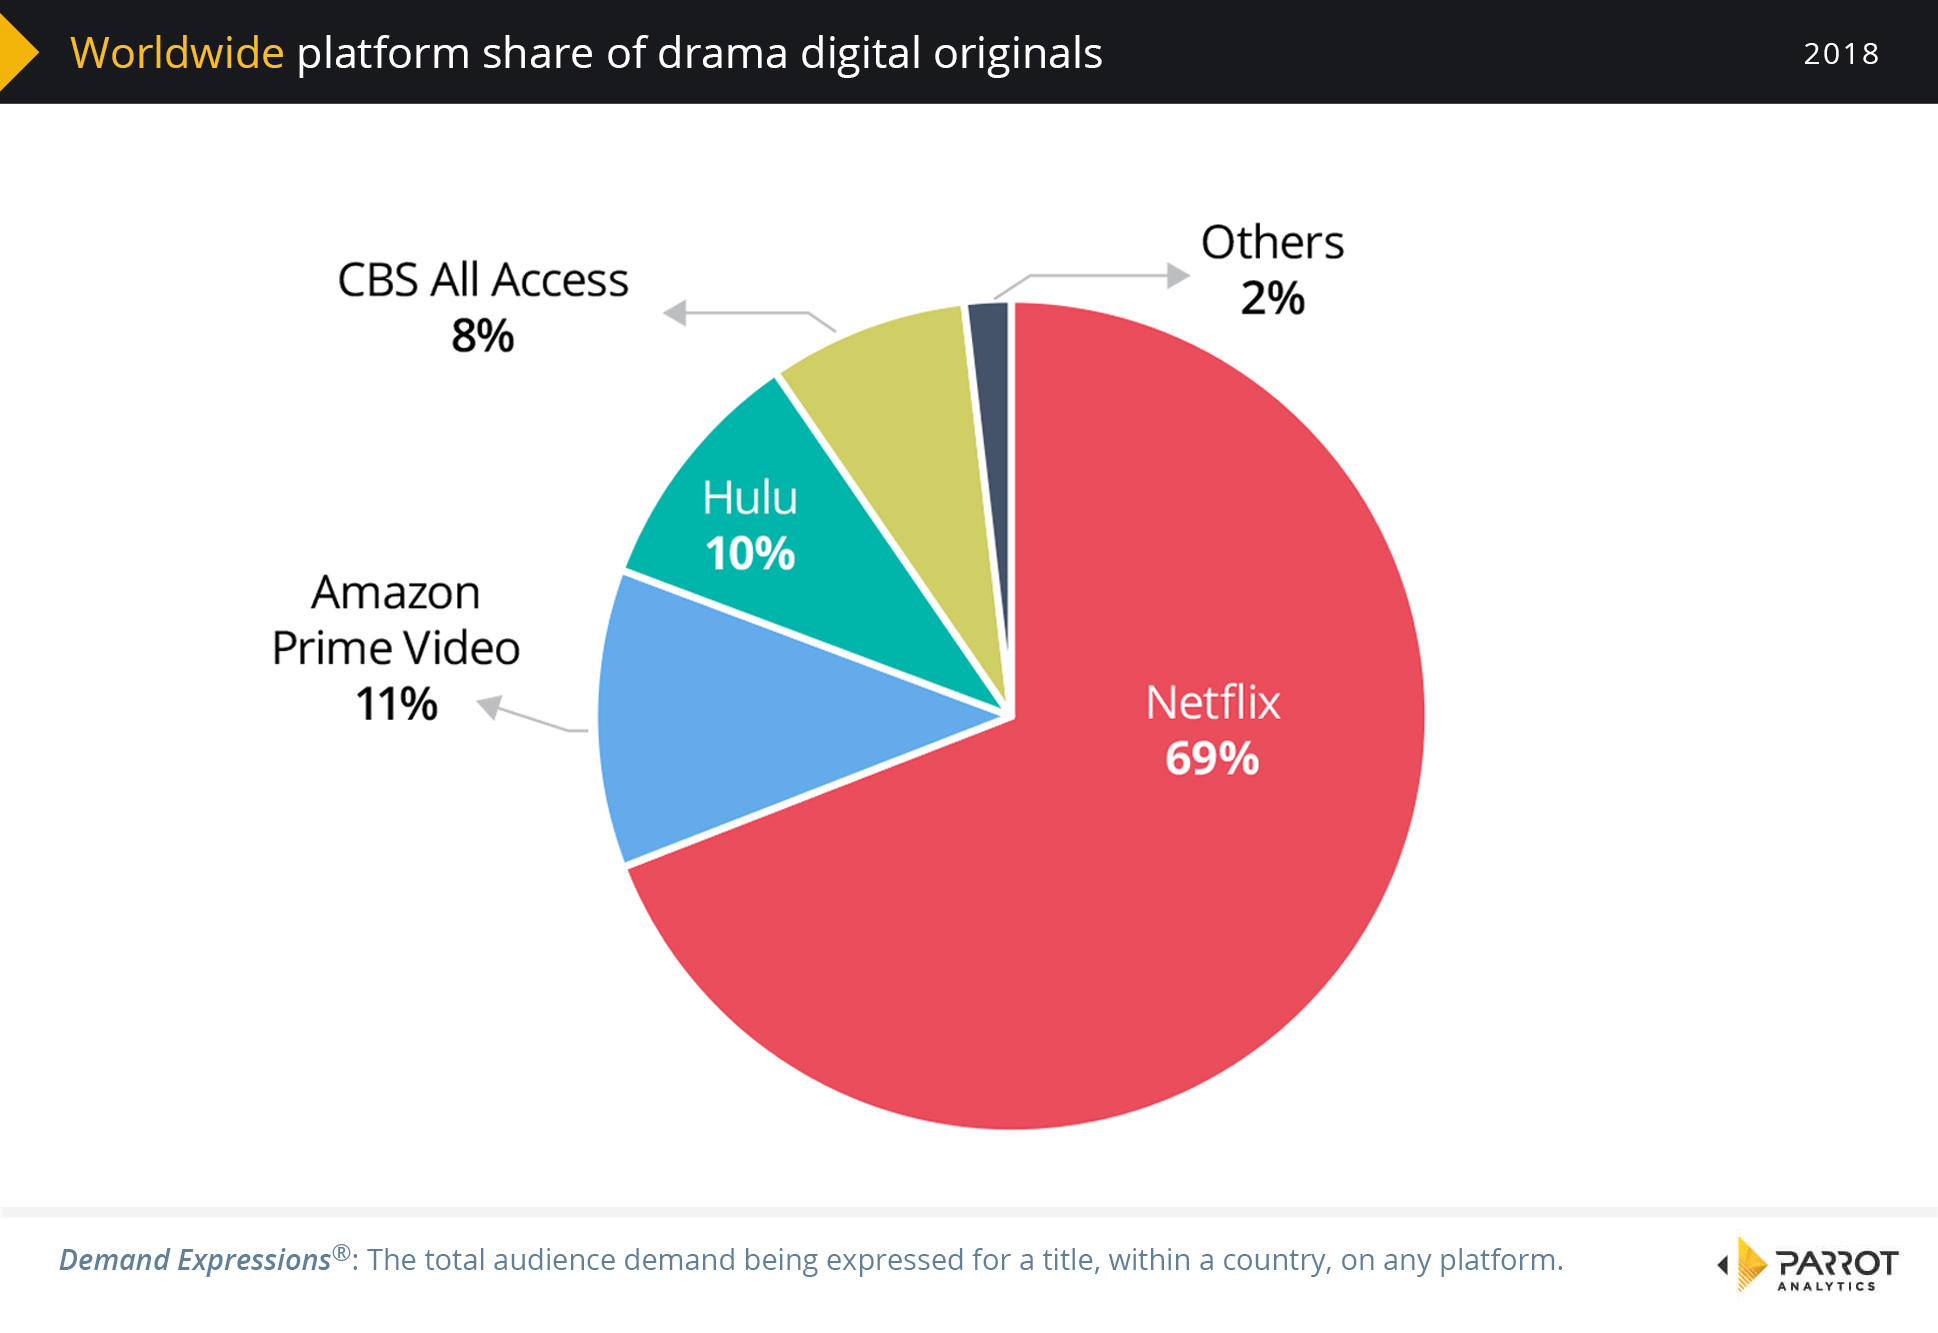
Here we define the global market share as the global share of demand for each platform’s drama digital originals. Based on this definition, we are able to make the following observations:
- For digital originals in the Drama genre, Netflix had the highest demand share around the world, but at 69% this is a smaller share than for all titles.
- Competition in this genre is fierce, led by Amazon Prime Video and Hulu with 11% and 10% global share of drama demand, respectively.
- The share of global demand for drama for CBS All Access titles in this genre is 8%, twice as large as their share across all digital originals.
The global market share of SVOD action/adventure originals
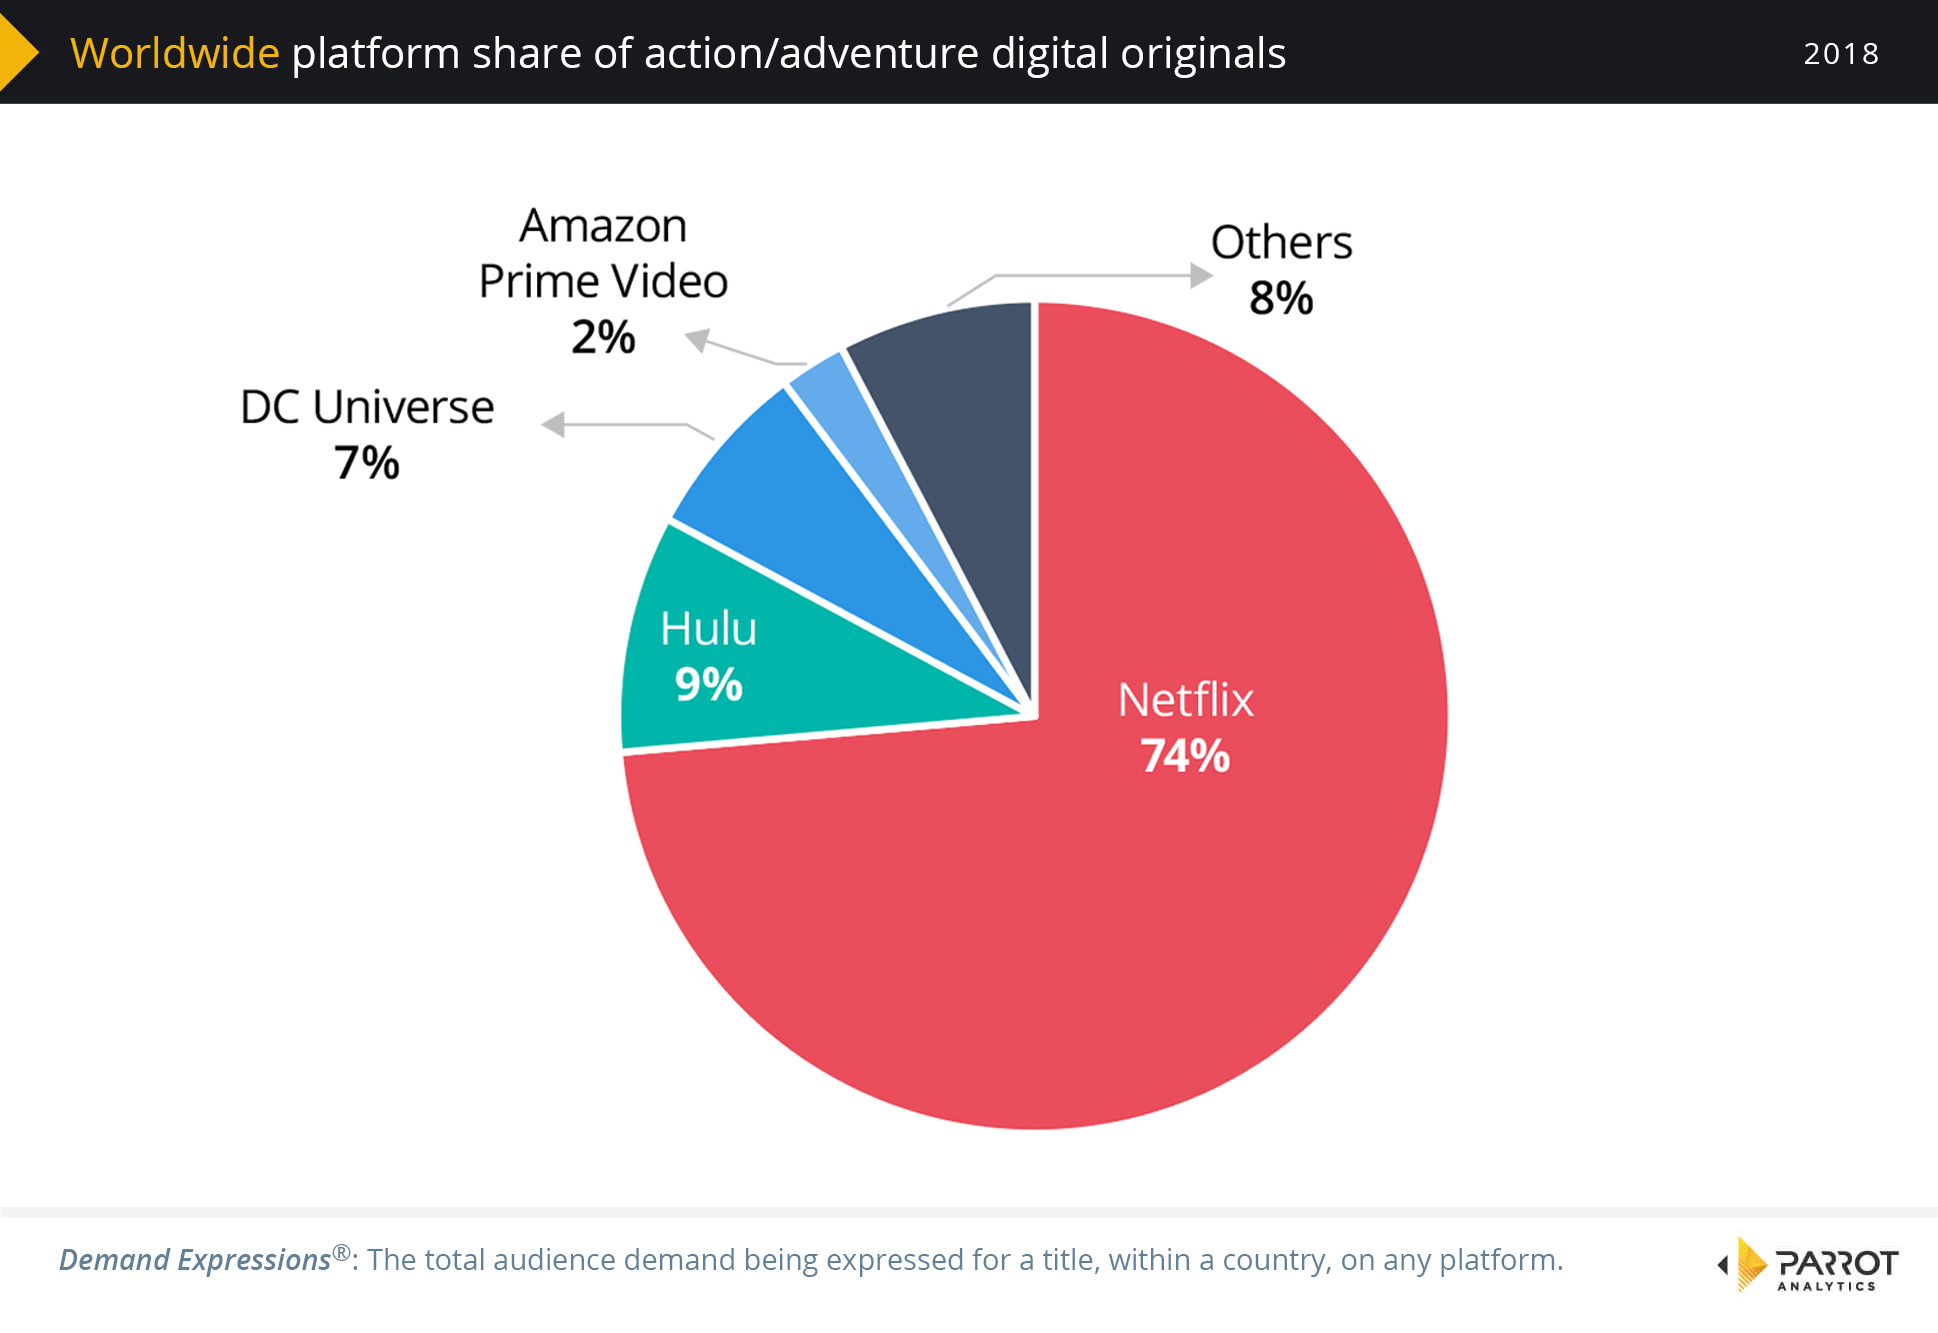
Here we define global market share as the global share of demand for each platform’s action/adventure digital originals. Based on this definition, we are able to make the following observations:
- In the Action and Adventure genre, including the huge superhero subgenre, Netflix titles have the largest global demand share with 74%.
- Hulu titles have the second largest demand share, accounting for 9% of the genre.
- The DC Universe service launched during 2018 and already DC Universe titles have a 7% share of demand in this genre.
The increase in global SVOD content investment
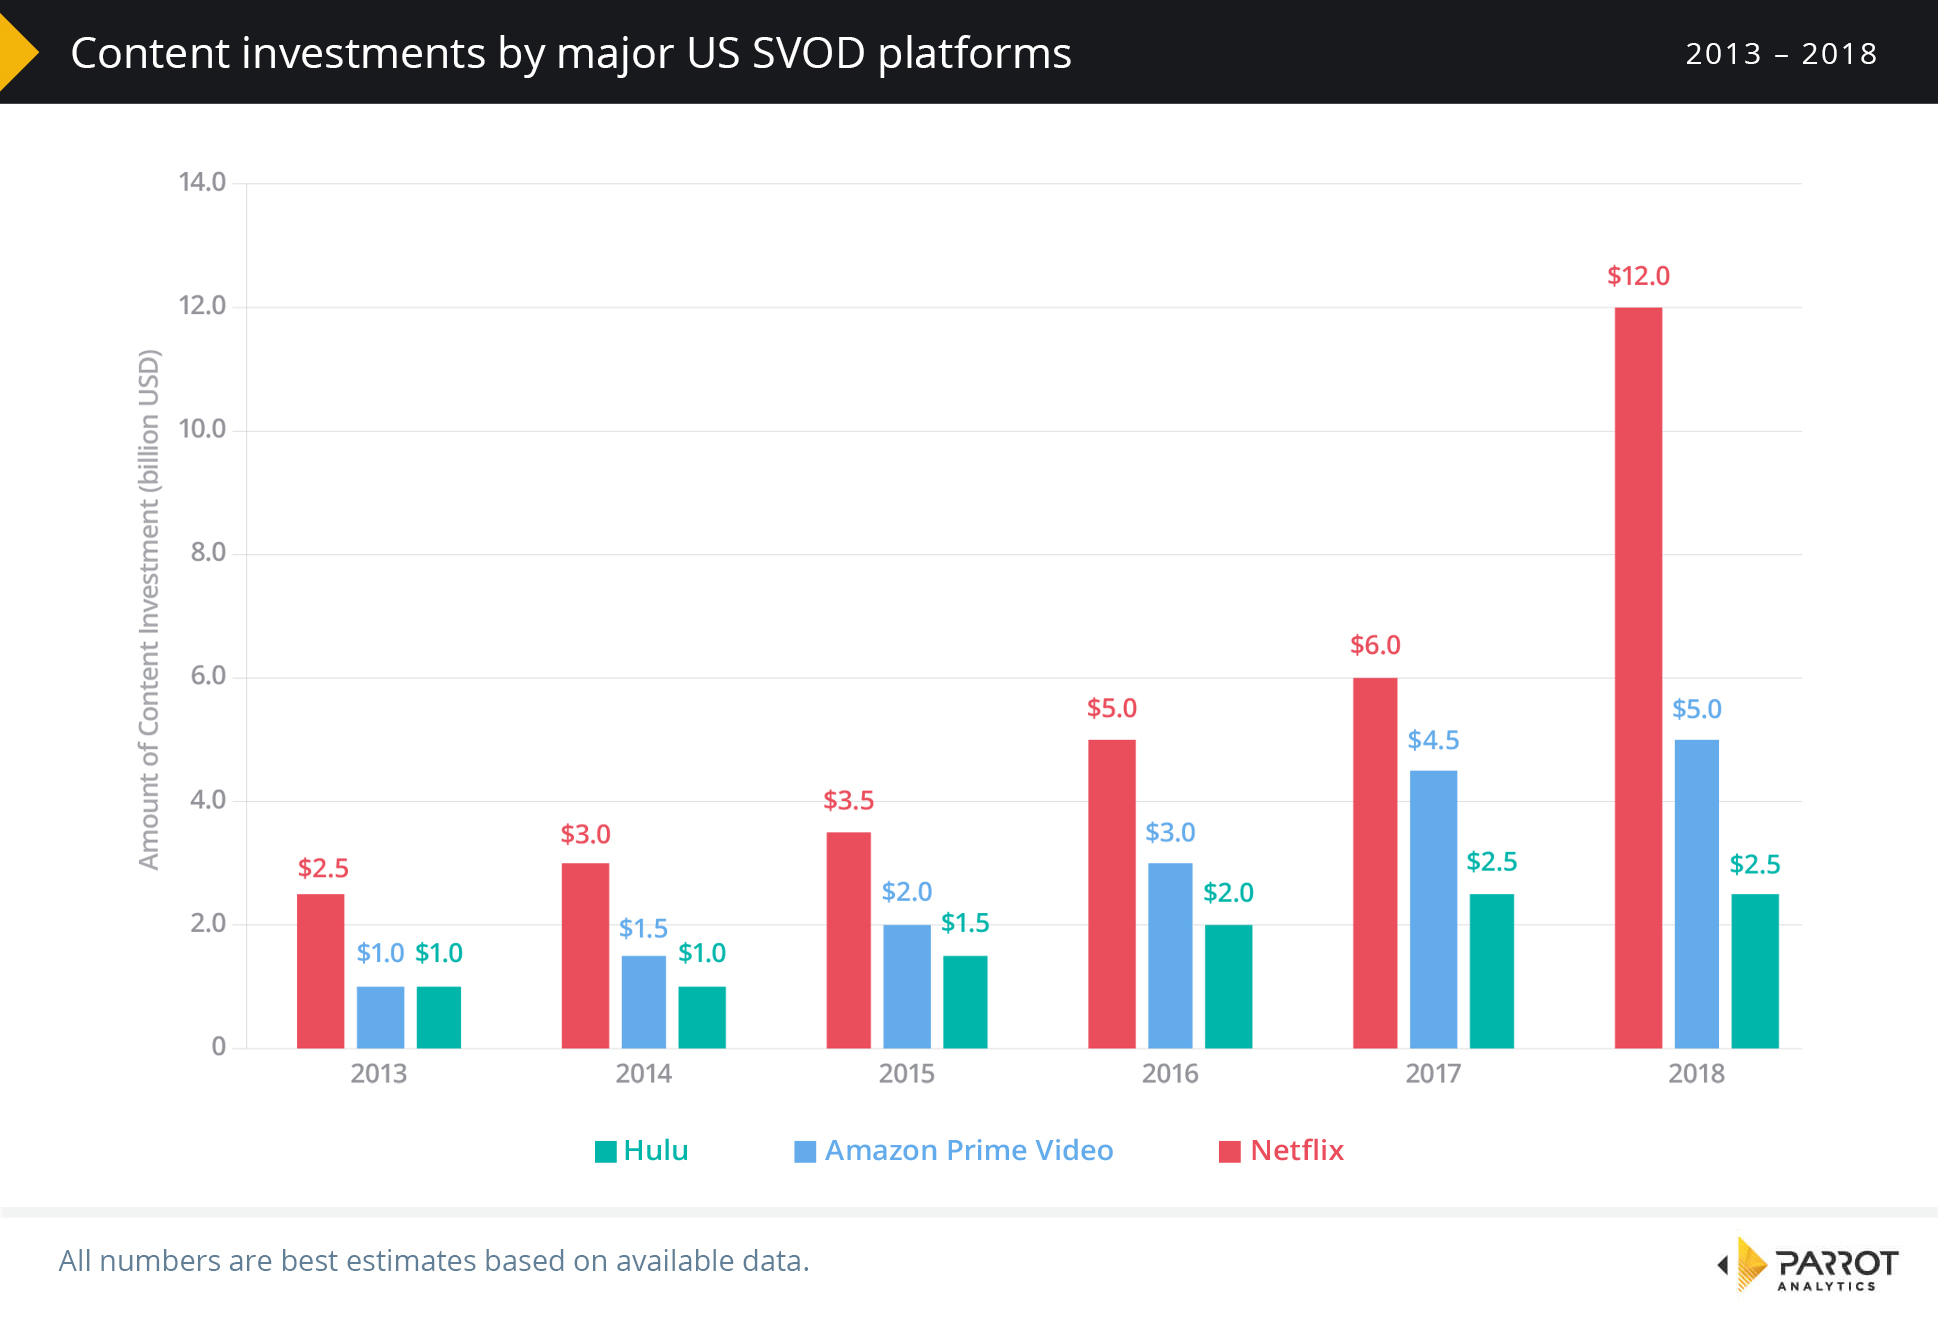
Together, the three largest US SVOD services have invested an estimated USD 19.5 billion in content creation and licensing during 2018; we are able to make the following additional observations:
- In 2013, the combined content spend was USD 4.5 billion, so content spending from just these three services has more than quadrupled in the past 6 years.
- At the start of 2018, the estimate for Netflix’s content spend was USD 8 billion; at USD 12 billion the actual 2018 spend exceeded that by 50%.
- Analysts have forecast the Netflix 2019 content budget to potentially be as high as USD 15 billion.
- The best estimate for Amazon’s 2018 content spend is USD 5 billion, a small increase from their 2017 spend.
- Hulu, in turn, invested an estimated USD 2.5 billion on content in 2018, a figure unchanged from their 2017 spend.
The increase in global SVOD subscribers
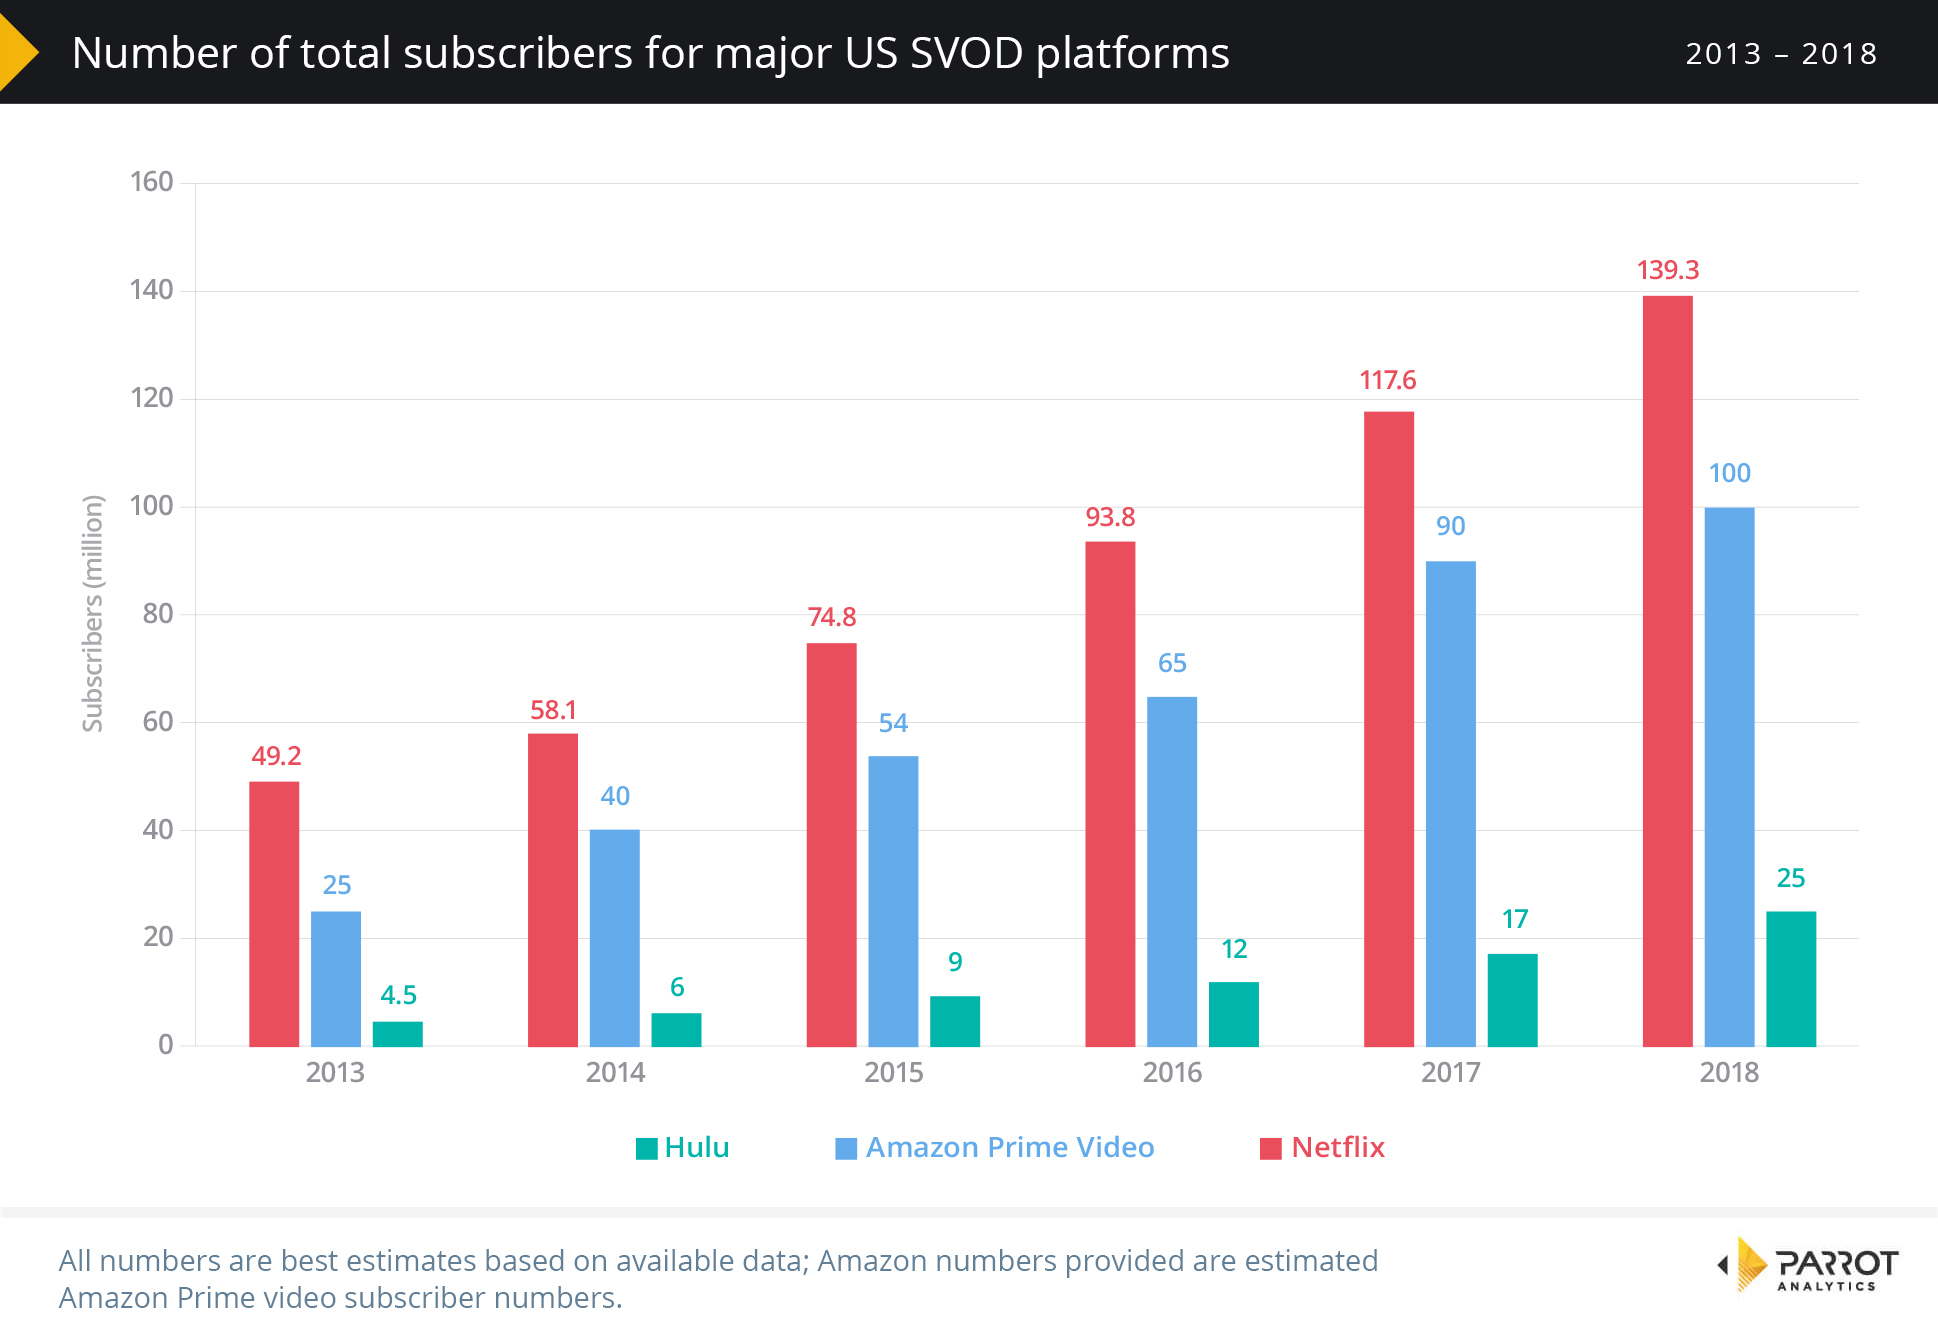
Netflix remains the largest streaming platform on the planet, reporting nearly 140 million international subscribers in their 2018 Q4 quarterly statement; we are able to make the following additional observations:
- Amazon does not release exact numbers for Prime subscribers, but in April 2018 CEO Jeff Bezos announced Amazon had over 100 million international subscribers. However, Amazon has not given any indications of how many Prime subscribers utilize Prime Video.
- Hulu is presently only available in the United States and Japan, so it naturally has a smaller subscriber base due to the much smaller addressable market.
- Disney CEO Bob Iger has spoken of “global growth” plans for Hulu after the Fox merger is complete and Disney becomes Hulu’s majority owner.
- Amazon increased the price of a US Prime subscription in Q2 to USD 119 from USD 99. Unfortunately, we have no information on whether this change affected Prime Video usage.
- Netflix increased the price of all US plans by at least one US dollar in January 2019 while Hulu decreased the price of its basic plan to USD 6 from USD 8. The effects of these changes, if any, will be observable in the coming quarters.
The increase in global digital original TV series
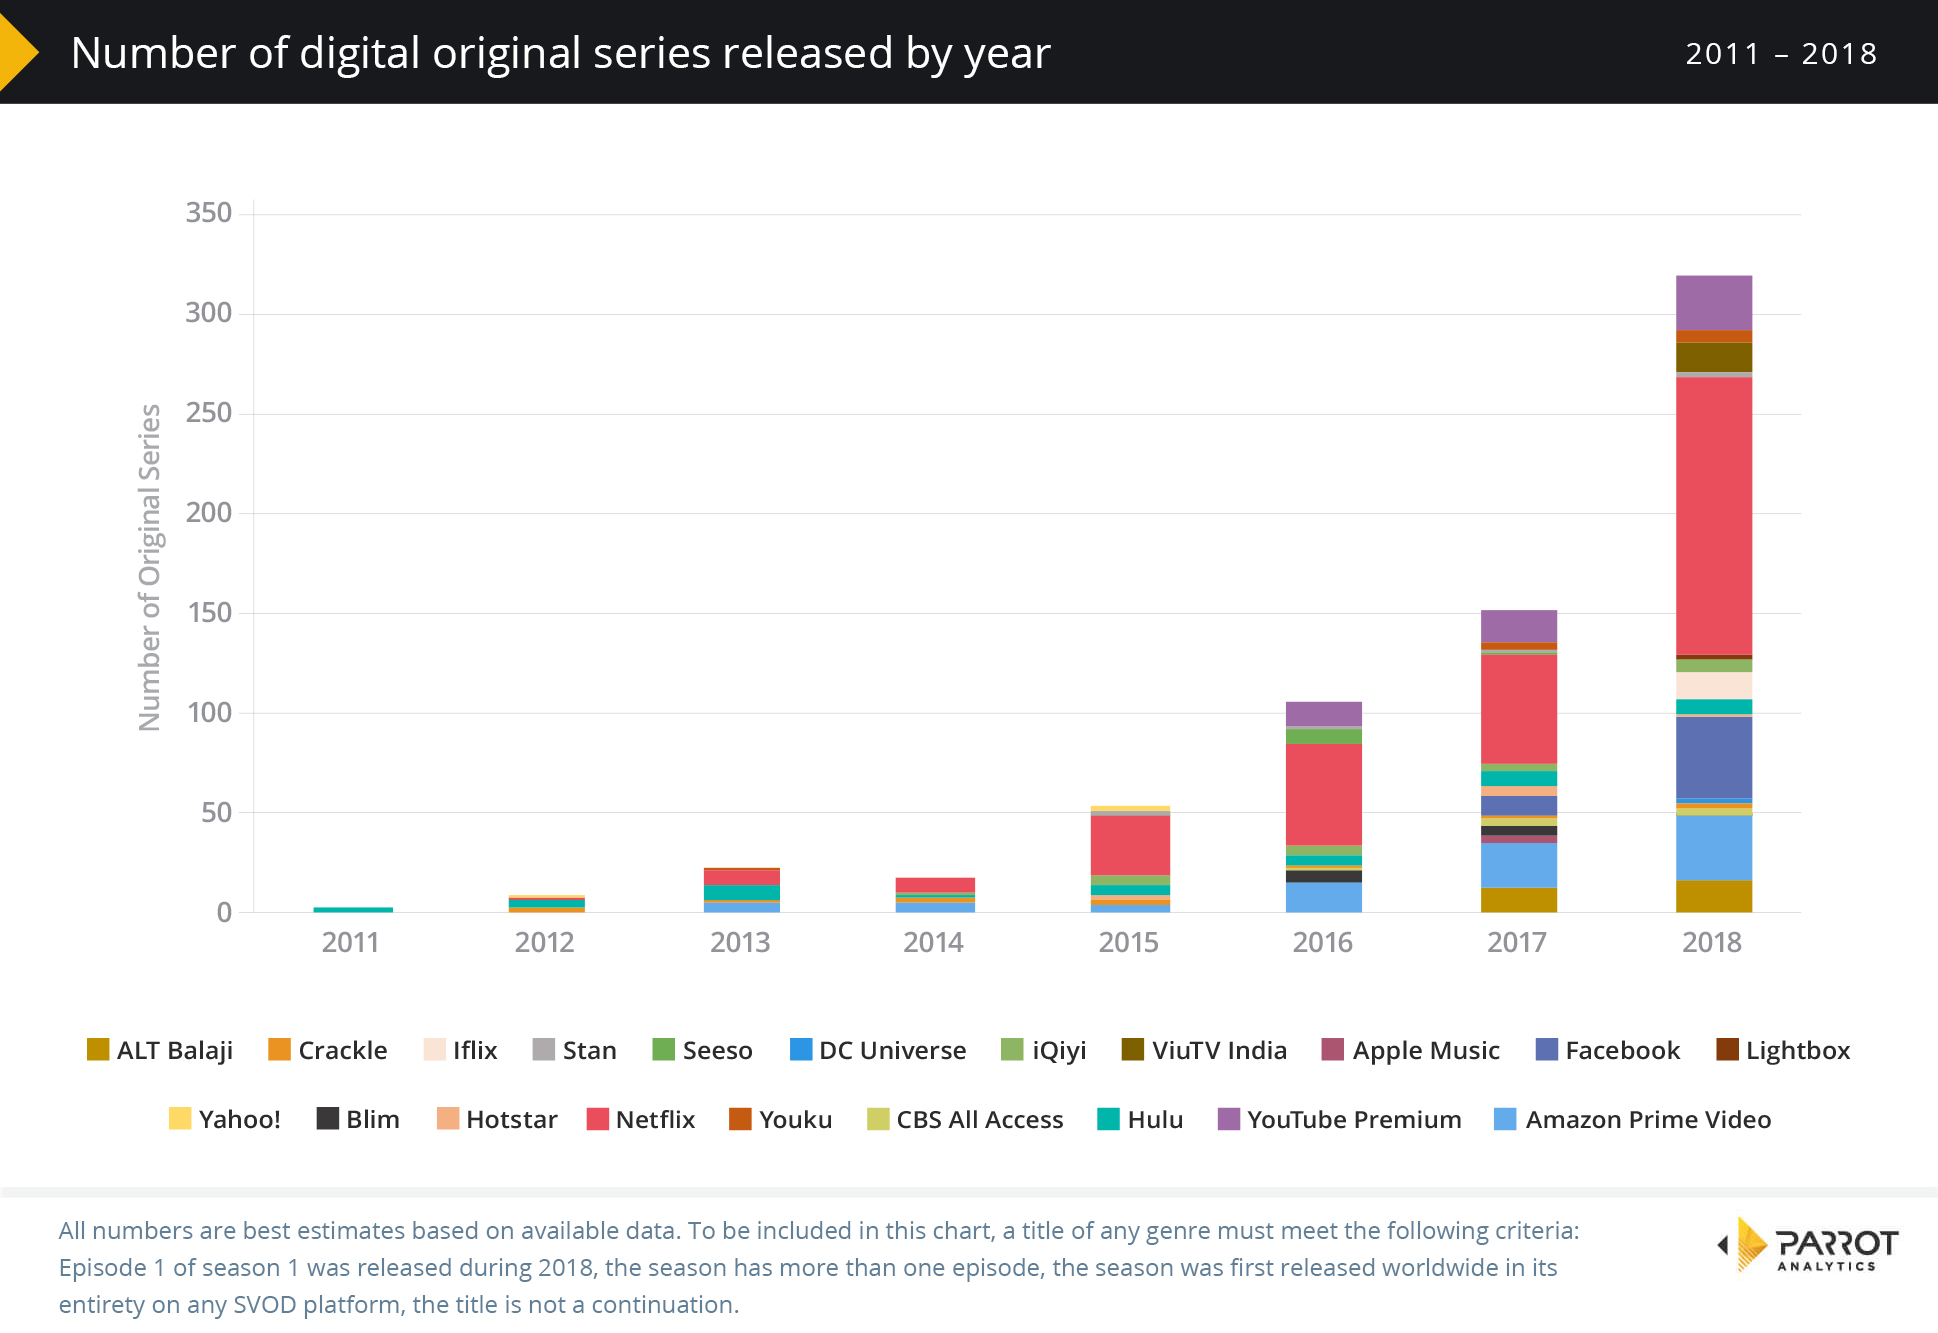
The rate of new digital original series released accelerated exponentially in 2018; we are able to make the following additional observations:
- At least 319 new digital original series premiered during 2018 around the world, up from 147 last year.
- Netflix remains the world’s largest producer of original SVOD series, premiering 139 new titles during the year. This is the nearly as many as all platforms combined released in 2017.
- Facebook Watch also greatly increased how many new series they released this year, debuting 41 new titles.
- We have tracked new digital originals from more services than ever before in 2018, as regional SVOD services compete with the global players by offering tailored content for local audiences.
Download the free global SVOD market share report
Download this report now and discover the latest global SVOD market demand trends based on our SVOD TV analytics capabilities. Our comprehensive global TV demand report includes the following insights:
Market-specific domestic TV Insights:
For the following territories included in this report – Australia, Brazil, Canada, France, Germany, Italy, Mexico, Spain, the United Kingdom and the United States:
- We reveal the 2018 SVOD market share in each of the 10 markets for the major platforms including Netflix, Amazon Prime Video, Hulu and CBS All Access based on audience demand for each platform’s digital originals.
- Discover how SVOD market share trends have changed over the last 24 months, including the contribution made by DC Universe.
- Find out what percentage of the market for drama and action/adventure digital originals each SVOD platform has managed to capture over the last 24 months.
- Learn where in the world content produced in each territory is the most wanted relative to the domestic home market; we refer to this as content travelability.
- Discover which sub genres resonate the most with local audiences compared to the global average.
- Find out what the demand distribution of a selection of digital originals in each of the ten markets looks like.
- Discover the top 20 digital streaming shows for each country, as well as 5 additional titles of interest in each market.
Global Television Insights:
- Find out the 2018 global SVOD market share of the major platforms including Netflix, Amazon Prime Video, Hulu and CBS All Access across 100+ markets.
- Discover the worldwide platform demand share of all drama digital originals as well as the worldwide platform demand share of all action/adventure digital originals.
- The increase in the global investment made by SVOD platforms over the last 5 years.
- The global growth of SVOD subscribers over the last 5 years.
- The increase in digital original titles worldwide over the last 7 years.
- A TV industry update for 2018 detailing important market events concerning SVOD services.
- We have also included a mini analysis of the global demand for critically acclaimed digital original comedies.
Note: This version of The Global TV Demand Report does not include any market share information for as yet unreleased SVOD platforms such as Apple TV+ and Disney+. Parrot Analytics publishes this report each quarter, be sure to bookmark https://insights.parrotanalytics.com/tv to gain access to the latest available market share report across all SVOD platforms.
After reading this article you may have a few questions, such as “How can TV series and SVOD platforms generate demand in markets where they are not yet available?” Please make sure to read our methodology for demand attribution and also our knowledge base article on how Parrot Analytics defines a “digital original” series.

