Image: Stranger Things, Netflix
The breakout television hit of the summer is undoubtably Netflix’s Stranger Things. Though it received little fanfare before its release, its supernatural plotline, excellent acting, and 80s homages have attracted millions of fans.
The show has topped the list of most in-demand digital originals since its release and out of all titles, it is second only to the ever-popular Game of Thrones. Another Netflix series, The Get Down, also premiered recently and although it is the most expensive series ever made, its popularity has not yet reached that of the more modestly-budgeted Stranger Things.
This performance is impressive, but how does it compare to the most recent seasons of past Netflix hits? The original release of titles such as House of Cards and Orange is the New Black made a similar cultural impact to Stranger Things; however, these titles are now on their fourth seasons. Are the patterns of demand different for returning and new shows? Do veteran shows still attract as much demand as fresh new titles?
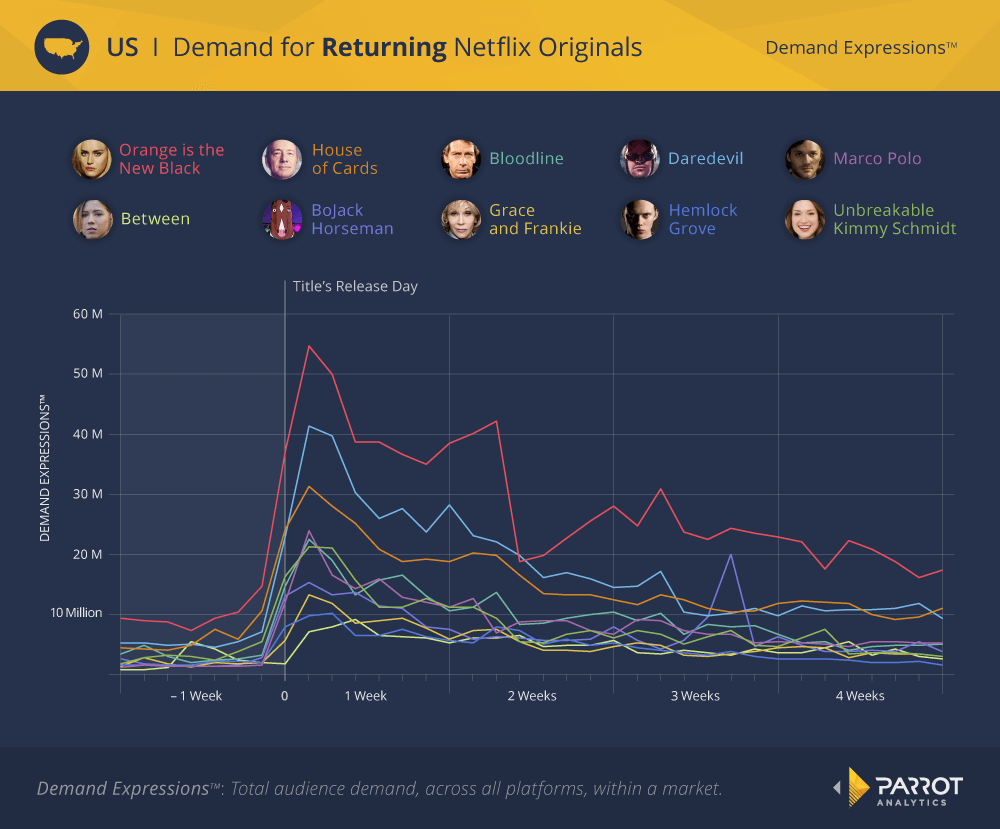
To compare titles at their peak, regardless of when they were released, the Demand Expressions™ for 7 days before release to 28 days after release are found for each title then plotted on this axis. The 0-day is each title’s release day and for most of these returning shows, their maximum level of demand occurs one or two days after it.

Even though it is on its fourth season, Orange is the New Black still clearly has the highest demand. Daredevil’s second season has about 75% of Orange is the New Black’s demand, while the only other fourth-season Netflix title, House of Cards, has about 60%. Demand for all the series decreases after release, as is typical of titles where the entire season is released at once. However, note that demand does not decrease at the same pace for all shows. Demand for Daredevil falls off faster than for House of Cards so that the more veteran show has more demand a month after release. Marco Polo, Unbreakable Kimmy Schmidt, and Bloodline have a higher peak than the other returning titles but at the end of the month all these lower-tier shows are about at the same level of popularity.
This slow decrease in demand is punctuated in a few cases by post-release spikes. As discussed in a previous post, Orange is the New Black has a resurgence in demand about seven days after its release. This second-weekend boost can be seen, to a lesser degree, in several other shows as well. BoJack Horseman has an unusual spike in demand over two weeks after release, perhaps related to marketing or press coverage. These one-off events do not reverse the general decreasing trends, though.
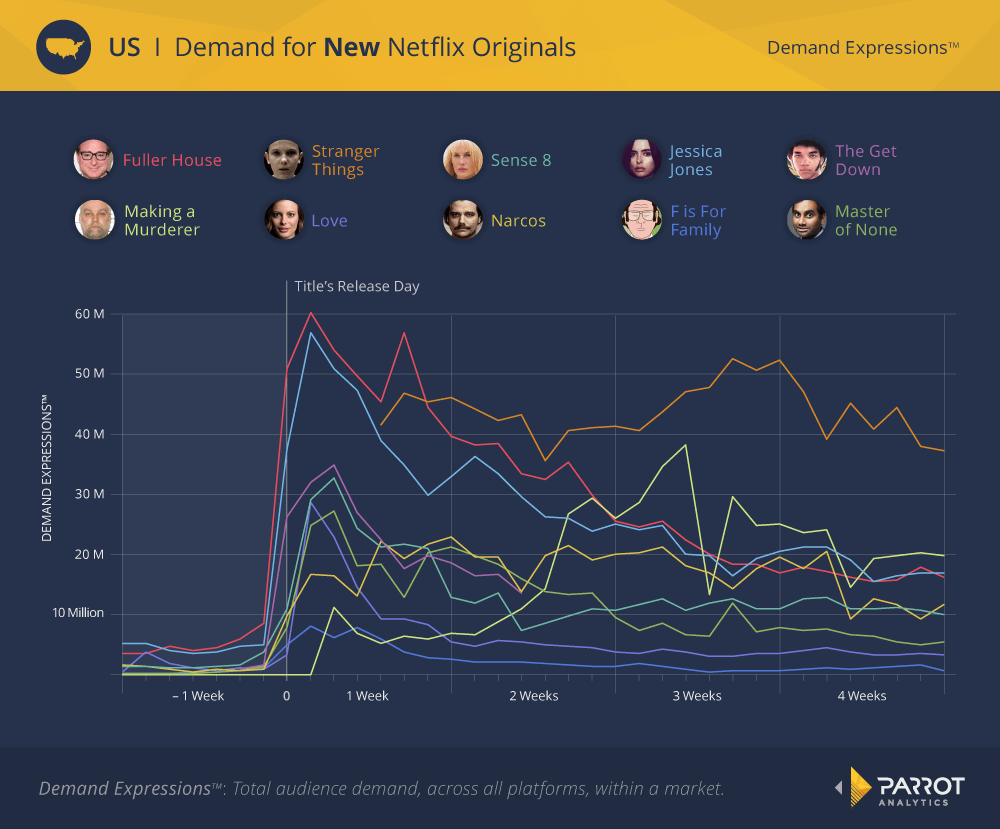
In contrast to the veteran shows, new releases do not all follow the same demand pattern.

The demand before release for these new shows is naturally lower, but their peaks on release can be just as large. The most immediately popular shows were Jessica Jones and Fuller House. Both shows feature second-week increases in demand and generally follow the returning shows trend, decreasing steadily in demand in the month after release. Several other new releases, such as Master of None and Love, also follow this pattern.
Note that the Demand Expressions for Stranger Things were not captured until four days after its release, but even with this absence a much different demand pattern is evident. Instead of peaking early and slowly falling over time, demand for Stranger Things actually increases over the first three weeks after its release. Making a Murderer (and Narcos to a lesser extent) also follows this pattern, premiering with the lowest demand out of these 10 new shows but having the second-highest demand a month after release. These two shows were surprise hits for Netflix: few people anticipated the release of these shows but once they watched it they promoted to their friends, causing viral growth in the show’s popularity.
While Netflix would have undoubtably wanted the same for the big-budget The Get Down, it appears from the available data that it will follow the more typical pattern of strictly decreasing in demand. While The Get Down had the third-highest release, its peak demand was just over half of the peak demand for Jessica Jones and Fuller House; it is not in megahit territory. The best result for The Get Down would be if its demand plateaued early and high like Sense8.
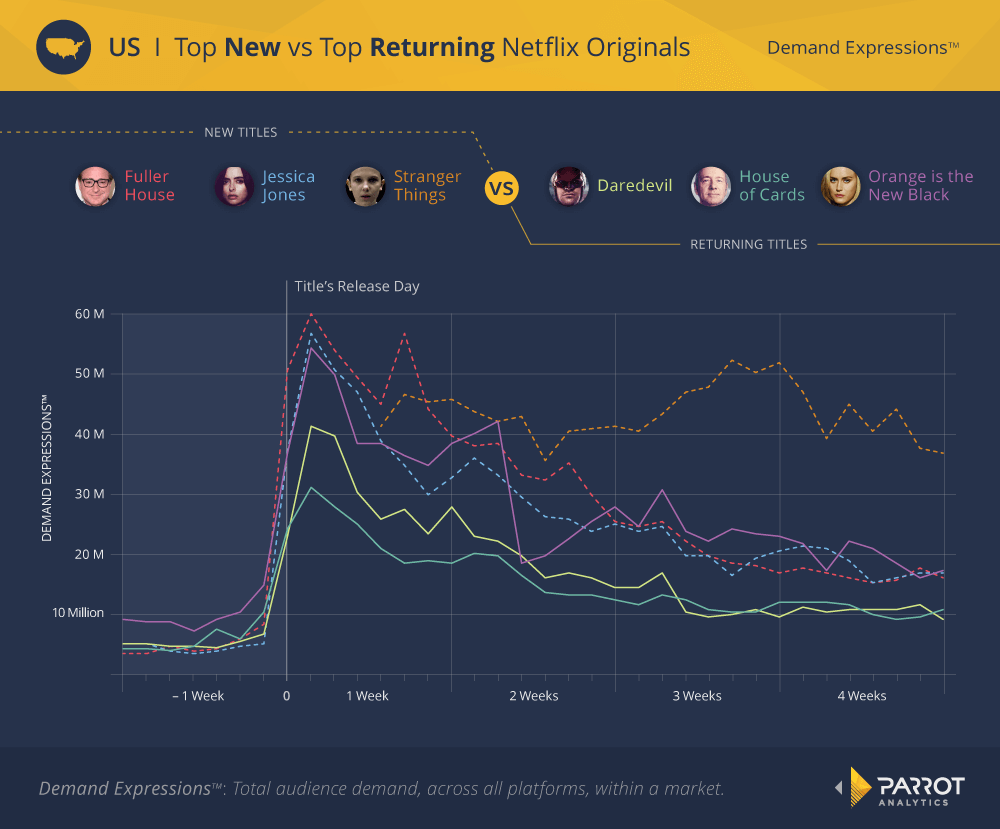
How do Netflix’s new batch of hits — Stranger Things, Jessica Jones, and Fuller House — compare to the top returning shows? When plotted on the same chart the new shows have more demand than the veterans, but not by much.

Orange is the New Black has under 10% less demand upon release than the new shows, the same amount of demand as Stranger Things nine days after release, and ends its first month just as popular as Fuller House and Jessica Jones. The other veteran shows, House of Cards and Daredevil, end with about 50% of these titles’ demand. Though it decreased by about 30% from its peak, Stranger Things dominates all of them with more than twice their one-month demand. Its viral growth appears to have stopped, but it is still left with the same level of demand as Orange is the New Black in its first week. Whether it will have the same high demand in three seasons’ time remains to be seen.
By comparing the demand at release for Netflix’s original series, we have determined that while most shows follow a similar pattern of decaying demand, viral hits such as Stranger Things and Making a Murderer increase in demand. This upward trend results in these titles becoming more popular than more established shows, such as Orange is the New Black. Even new shows that follow a more typical pattern can outpace older shows, as Fuller House and Jessica Jones have proved. While these new shows are successful now, part of the value of shows like House of Cards is their longevity. Netflix can only wait and see if their new hits have the same trait.

