Image: Chilling Adventures Of Sabrina, Netflix
Parrot Analytics is able to measure television demand for both linear and subscription-video-on-demand (SVOD) content in the U.S. and in 100+ other countries by applying our global television demand dataset. In this weekly report, which focuses on the U.S. domestic market for the week ending October 27th, we have analyzed the top linear broadcast, Pay-TV and cable shows in the U.S. along with OTT-first titles encompassing SVOD, AVOD and TVOD.
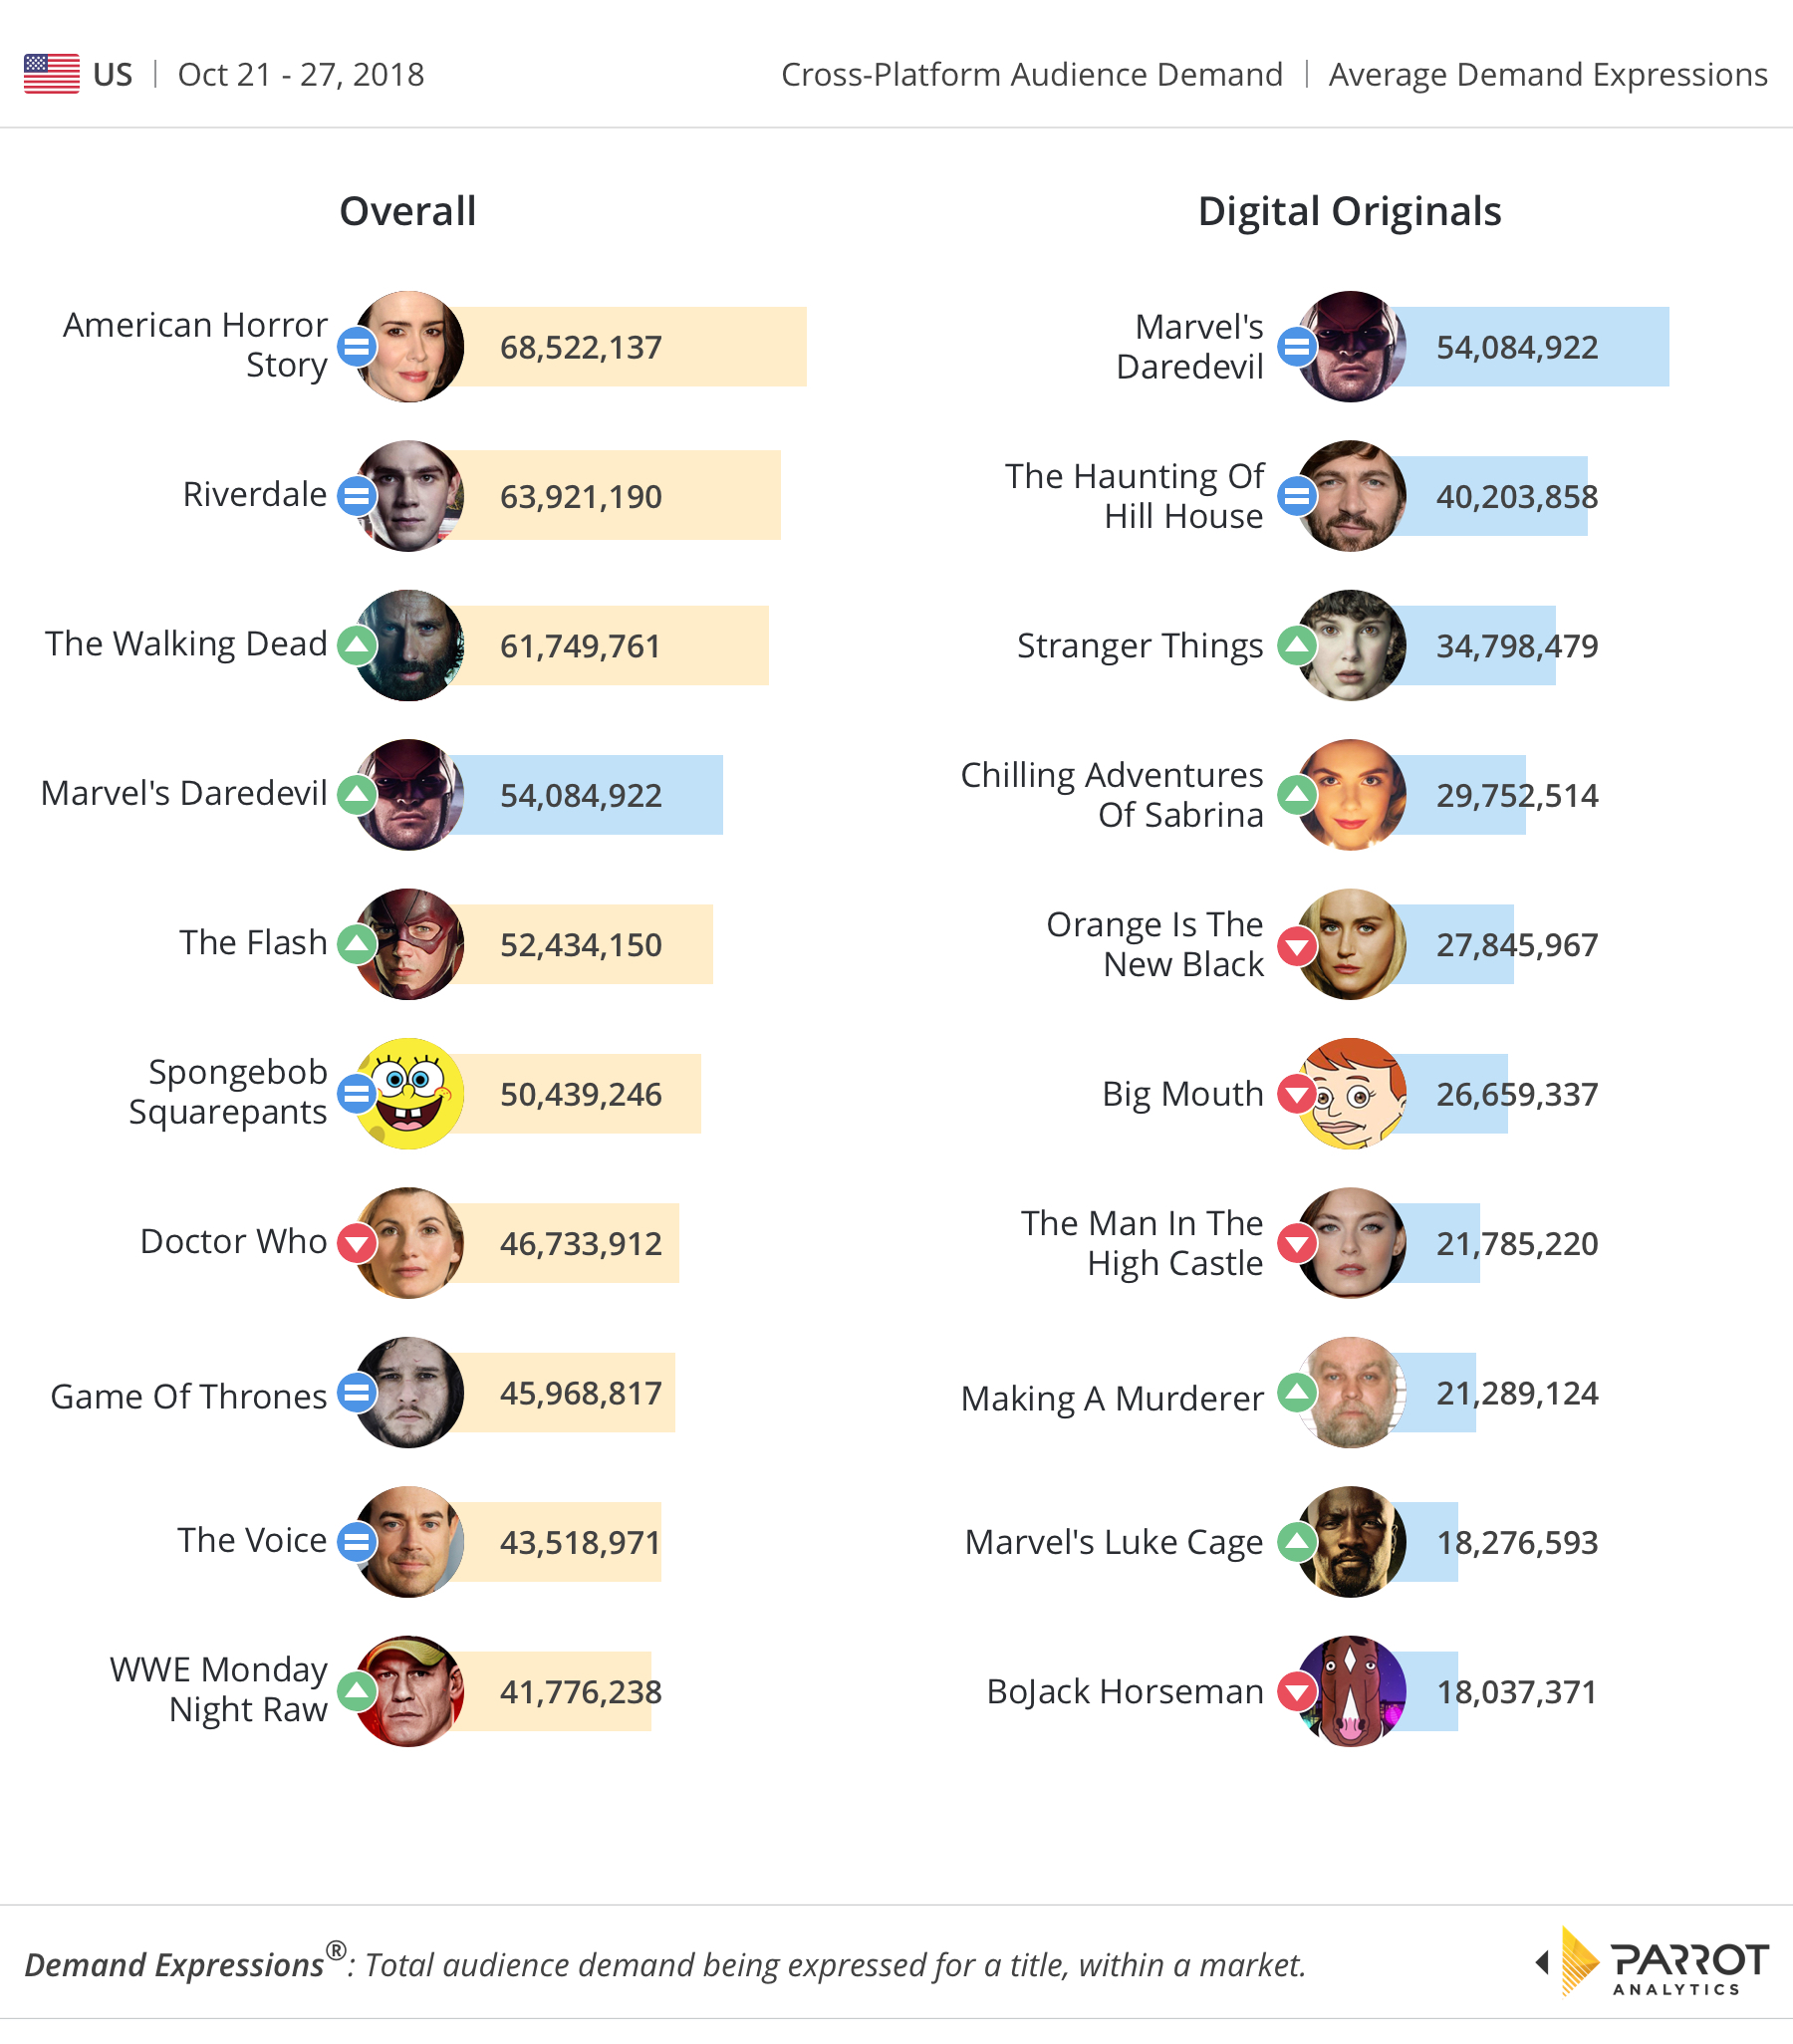
We have observed Halloween-theme titles making a strong appearance in the top ten digital originals chart. First there is Netflix’s The Haunting Of Hill House with no change in rank compared to last week as well as Chilling Adventures Of Sabrina, which jumped from No. 18 to No. 4. – the former increased 8% in demand compared to the previous week whilst the later jumped by over 125%.
Both Netflix drama titles are reboots of existing material, involving a new cast and story lines and we suspect Chilling Adventures Of Sabrina experienced its 2-fold increase in average daily Demand Expressions due to the premiere on October 26th.
Netflix’s Making a Murder has experienced the sharpest increase in demand post its second season release on October 19th (+230%).
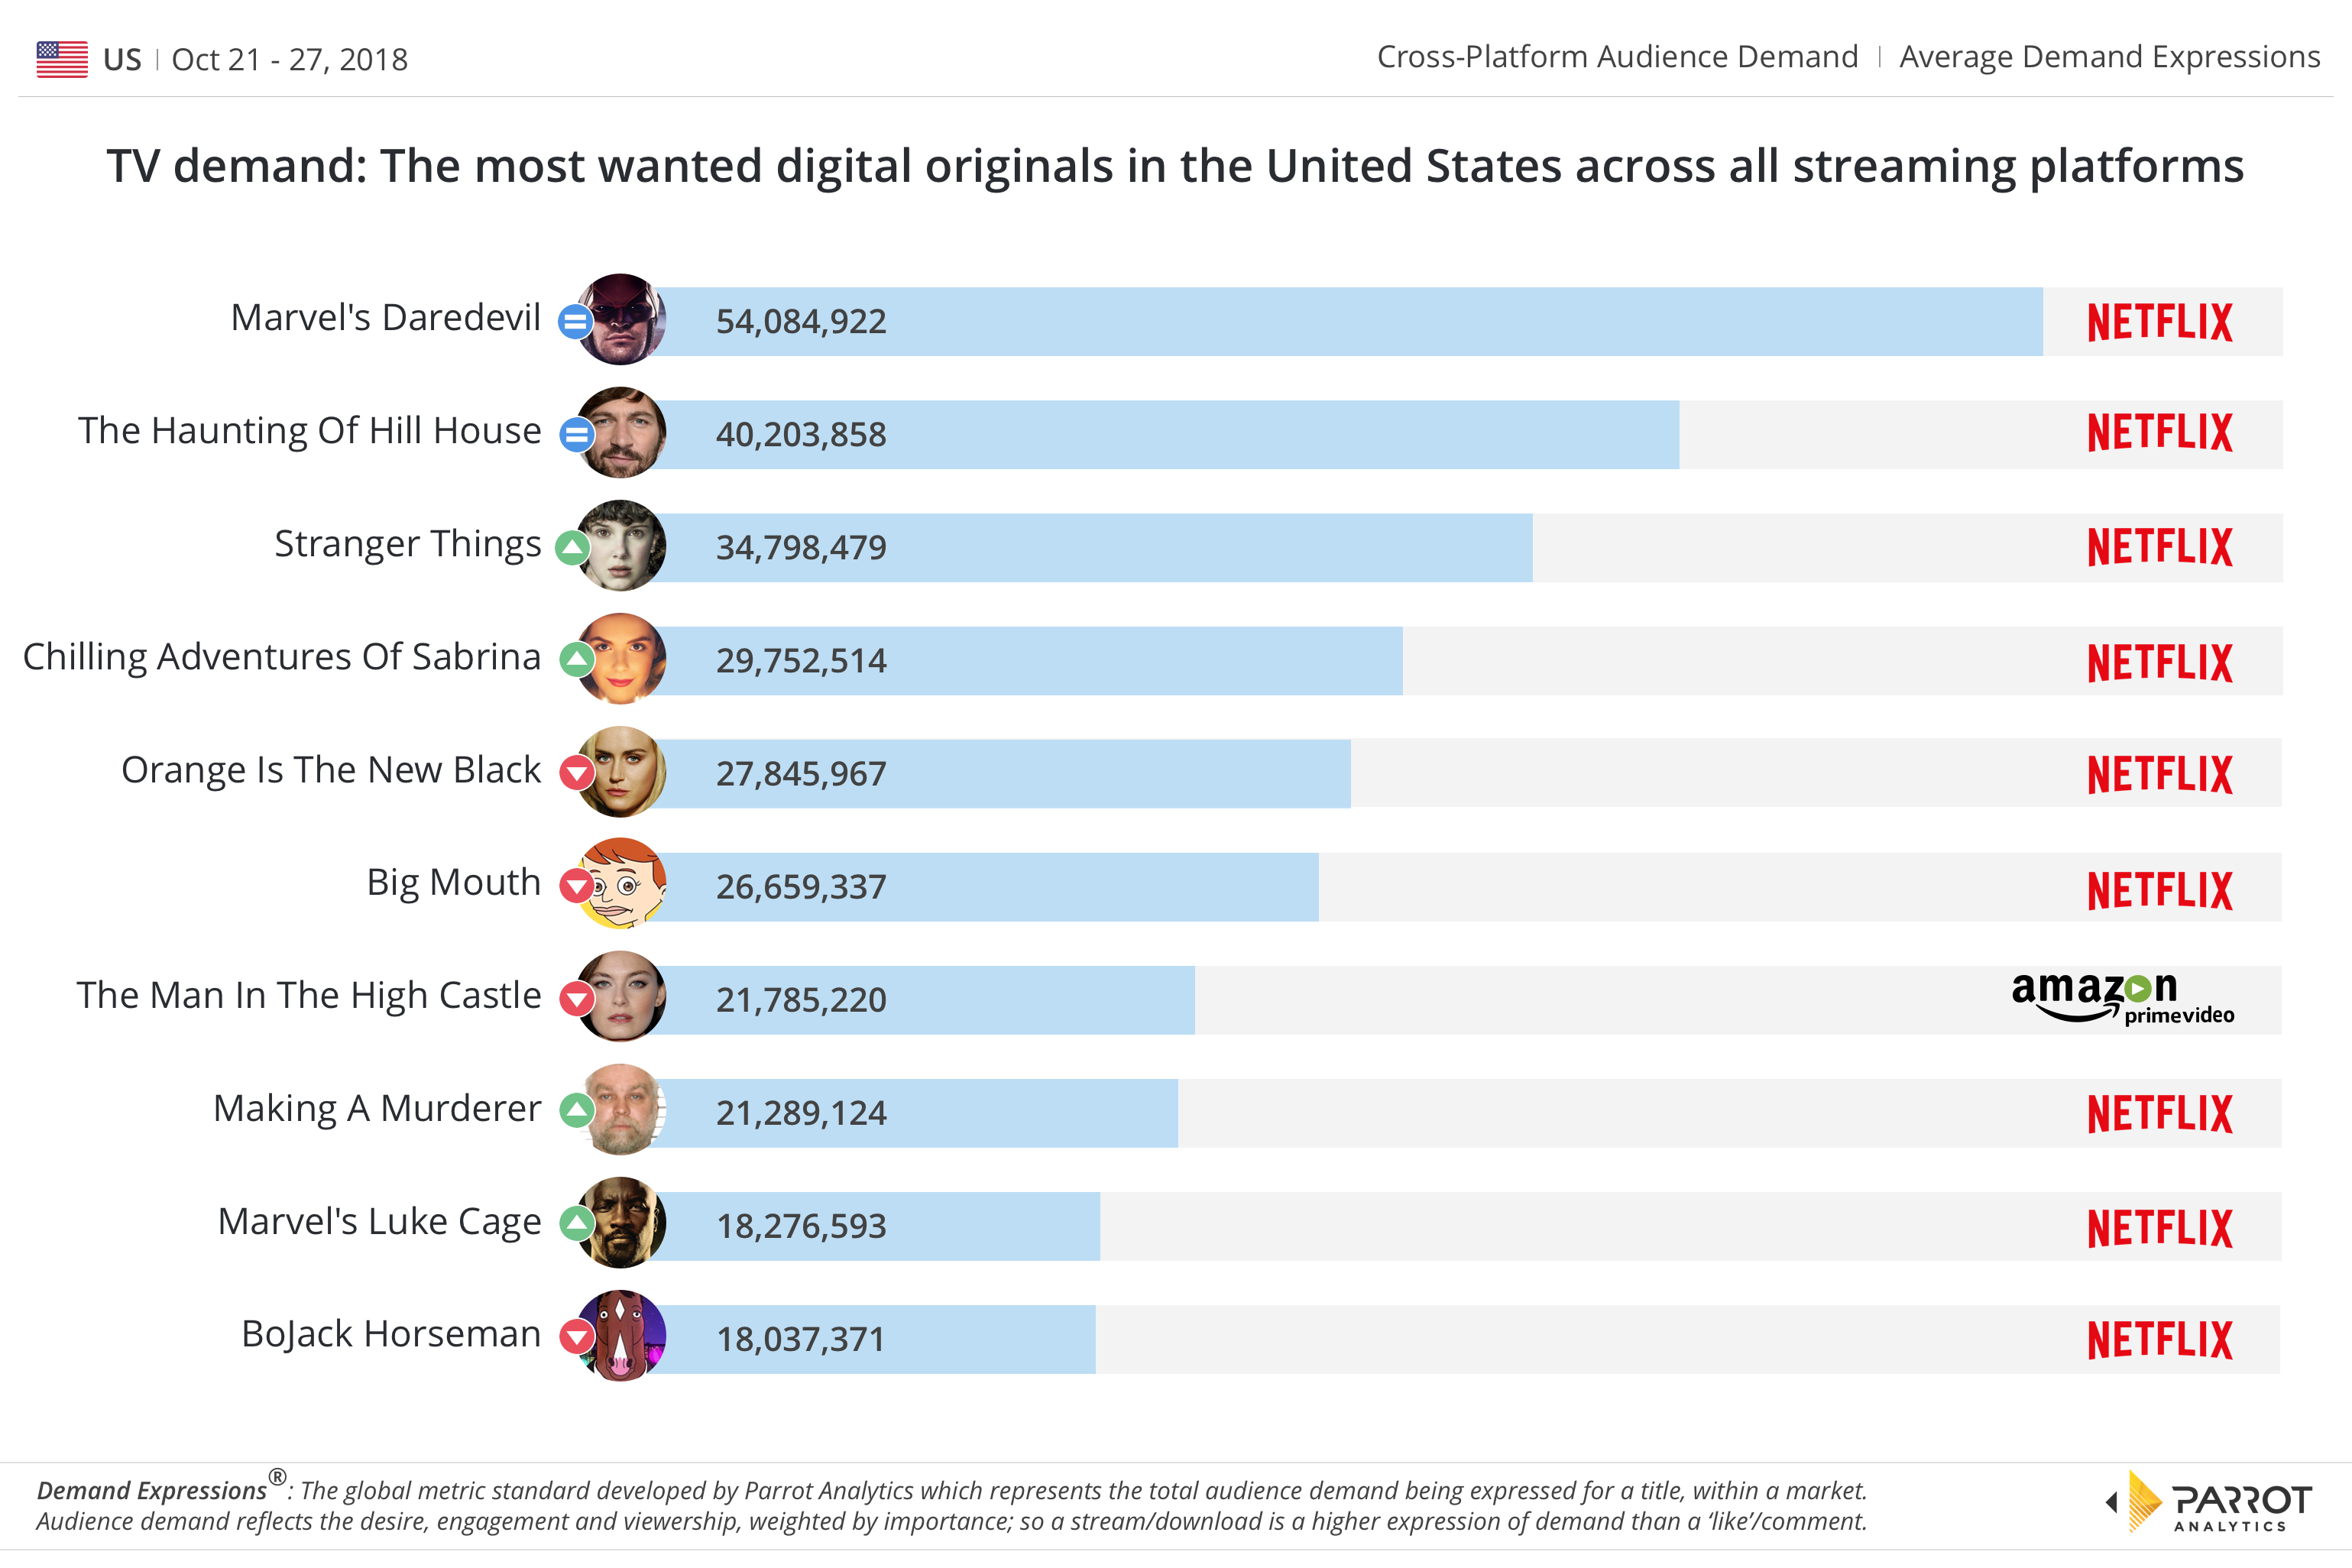
Still on the digital originals chart, Marvel’s Daredevil with 44% more demand compared to the prior week remains the most in-demand title this week, also featuring at #4 on the overall chart. Meanwhile, Marvel’s Iron Fist (ranked #21 the previous week) also generated high demand likely due to the news of its cancellation. Both Marvel/Netflix titles released new episodes this year and we expect audience enthusiasm for both dramas to continue for a little while yet.
On the overall chart, American Horror Story, Riverdale, Spongebob Squarepants, Game of Thrones and The Voice all stayed in the same ranking as the previous week. In contrast, demand for Doctor Who fell roughly 10% week-on-week despite its episodic release format.
For more information, reach out to Parrot Analytics for a live demonstration of our Demand Portal, or watch our latest product video.
The data in this article are based on Demand Expressions (DEX). DEX is the globally standardized TV measurement metric developed by Parrot Analytics, which represents the total audience demand being expressed for a title, within a market. Audience demand reflects the desire, engagement and viewership, weighted by importance; so a stream/download is a higher expression of demand than a ‘like’/comment.