Image: Sacred Games, Netflix
On July 6th 2018, Netflix released the full season of their first Indian original title. Based on an award-winning novel of the same name, Sacred Games is a crime drama set in Mumbai and features characters representative of all parts of India. Critics both inside and outside of India have generally praised the series, but it has also attracted controversy and condemnation from politicians over how a character refers to former Indian Prime Minister Rajiv Gandhi.
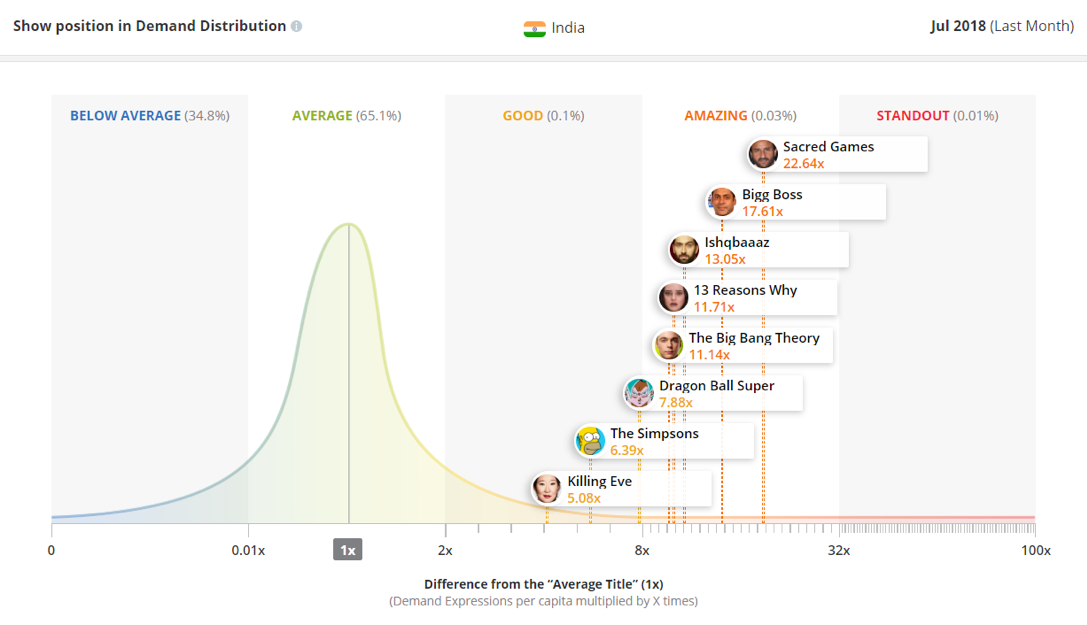
Regardless of the controversy, Indian audiences have been enthusiastic about Sacred Games. The show is by far the most in-demand title in India for the month of July 2018, with nearly 30% more demand than second placed series Bigg Boss and 22.6 times more demand than the average title in the Indian market. The following chart contextualizes this success this by showing the placement of Sacred Games and other titles on the Demand Distribution Curve for India in July:
As well as being made available in India, as a Netflix Original title Sacred Games was also released in every other Netflix market. Although Netflix is likely satisfied with how the title performed in India, the primary market for Sacred Games, as an international distributor of content they will be keeping a close eye on how the show is performing in markets outside India.
To gauge the show’s success on this front, we will leverage Parrot Analytics’ globally standardized Demand Expressions metric to determine how Sacred Games has performed in other Asian markets.
How Sacred Games has performed in other Asian markets
To investigate the international performance of the title, we can look at the average Demand Expressions per 100 Capita for Sacred Games over the month of July 2018 in Asian markets. Using a per capita normalization like this allows for a direct comparison of demand for a show across multiple markets.
The chart below shows the ten Asian markets that have the highest demand for Sacred Games in the month of July 2018.

The huge demand for Sacred Games in India ensures that the Indian market is by far where the show enjoyed its best performance in Asia. In fact, the title did so well in India that this market has 4 times the demand of the second-placed territory.
Although overshadowed by the huge demand experienced in India, Sacred Games has also achieved reasonably good popularity in the neighboring markets of Pakistan and Bangladesh, where in both countries it was ranked in the top 50 highest in-demand titles for July: 28th in Bangladesh and 44th in Pakistan.
Over- and under- performance compared to Indian title averages
To contextualize the demand for Sacred Games, we now compare the travelability of the show to the average travelability of titles from India. Parrot Analytics’ globally standardized travelability metric makes comparisons easier by normalizing the demand per capita of a show or group of shows with that in the show’s primary market (its home market).
As was shown in the previous chart, the Asian market besides India where Sacred Games performed best is Pakistan. For July 2018, Sacred Games has a travelability in Pakistan of 25%, meaning that demand for the show in this country is one quarter of the demand for the show in India.
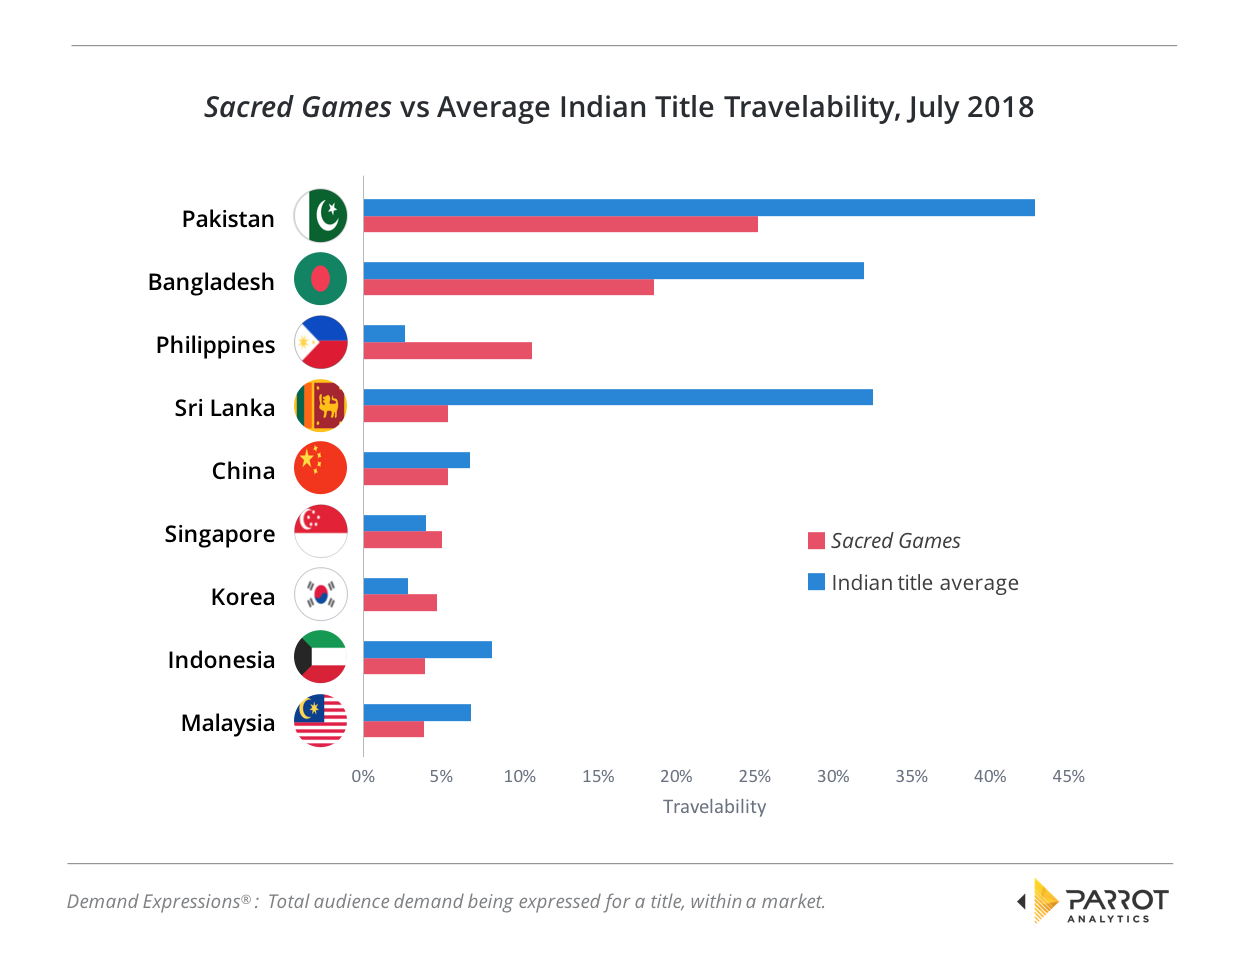
Comparing the Asian travelability of Sacred Games to the average travelability of all Indian titles during July 2018 shows how this title has both under- and over- performed in Asian markets: The fact that this show was available on Netflix in all countries at the same time has helped Sacred Games outperform the average Indian title in markets like the Philippines, Singapore and Korea, where Indian titles typically do not perform strongly.
However, in markets that are typically strong for Indian titles like Pakistan, Bangladesh and Sri Lanka, the show underperformed the average Indian title in travelability. This is especially pronounced in Sri Lanka, where Sacred Games has 28% less travelability than Indian titles typically do. This perhaps indicates that a more traditional, weekly release through established distribution channels would have been a better approach for Sacred Games in these markets.
For more information about how widely your TV show is watched across Asia, reach out to Parrot Analytics for a live demonstration our Demand Portal, or watch our latest product video.