Image: America’s Funniest Home Videos, ABC
The U.S. summer is here, and people are increasingly “out and about” and enjoying the sunshine. Most platforms have now aired the finales of the scripted comedies and dramas that returned to screens in January and February.
New scripted content is scheduled to arrive on fall schedules, although there are an increasing number of platforms that are exceptions to this rule. And while scripted series may be on hiatus, unscripted content is going strong: The heat of the season evidently has people in the mood for some light entertainment – and viewers can find exactly that in reality content.
To investigate how reality titles are performing worldwide, in this analysis we will leverage Parrot Analytics’ global tv demand data to understand which reality titles people are tuning into, across all platforms – globally.
The most in-demand reality titles in the world
Finding the world’s most in-demand reality titles is a simple matter with our versatile Demand Expressions per 100 capita (DEX/c) metric. By normalizing for the population of each country, a true country-to-country analysis of the demand for each reality show can be carried out.
To see which titles are most popular globally, we have ranked all reality shows by their average DEX/c across every market, for the period 1st of May to 1st of July 2018. It must be noted that we have applied our genome title classification to this dataset: A title such as Running Man is therefore excluded from this analysis on the basis that we have chosen to classify it as a variety show first, reality second.

The world’s most in-demand reality title over the May/June 2018 period is ABC’s Alfonso Ribeiro-hosted clip show America’s Funniest Home Videos. The universal nature of this show gives it a strong international appeal: Perhaps ABC should retitle it The World’s Funniest Home Videos?
AFHV is the only clip show placed highly, with the remaining four of the top five reality titles all being competition-based, led by the fabulous RuPaul’s Drag Race from VH1. However, one franchise has two entries in the top five with Britain’s Got Talent and America’s Got Talent taking third and fourth place respectively.
The rest of the top twenty reality titles is more diverse, with subgenres ranging from comedy, dating, lifestyle and of course, paranormal/parascience.
Interestingly, despite audiences having easy worldwide access to reality titles from globally-operating streaming platforms like Netflix and Amazon, no Digital Original titles are in the top twenty. The highest ranked Digital Original reality title is Netflix’s Queer Eye, which is the 30th most in-demand for these dates.
While the majority of the highest in-demand titles are from the USA, there are also British and Australian titles performing well on the world stage.
Where is America’s Funniest Home Videos most popular?
As we now know what the most popular reality title in the world is, we can dive deeper. By analysing the popularity of this title for each individual country, we can see which countries expressed the most demand for America’s Funniest Home Videos. We do this by normalizing the demand for AFHV to its “home country” of the USA.
By taking the U.S. as the index market, we can therefore say that AFHV’s market of origin has a travelability of 100%, with the other countries generating a percentage of that market’s demand.
This can be visually illustrated in a global content travelability map, which is what the next chart shows.
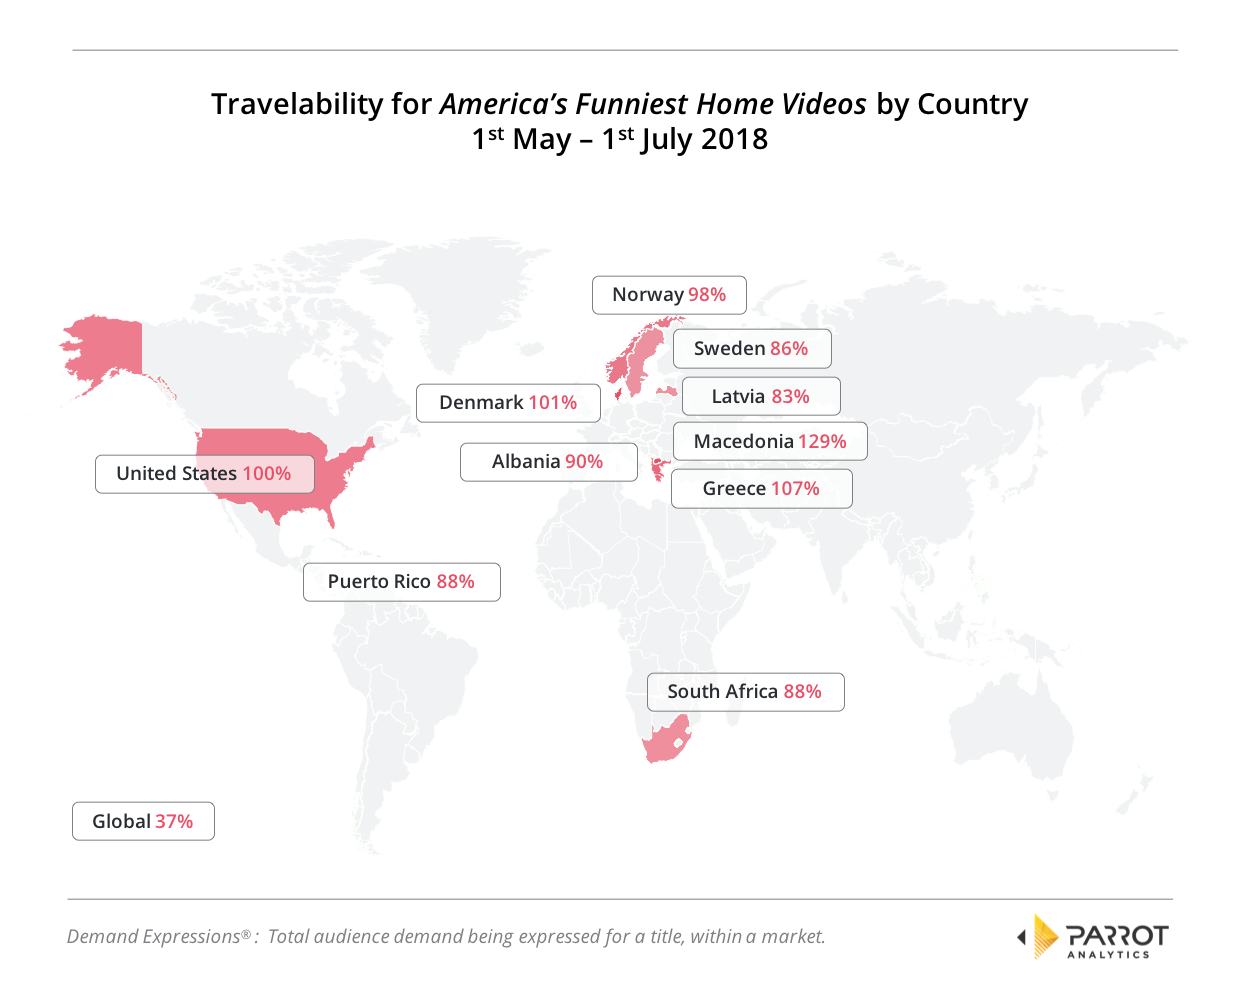
We stated earlier that the universal nature of AFHV has given this title global appeal – and our global TV demand data substantiates this: The global travelability of this title is 37%, which is far higher than most reality titles. Quite simply this means the show travels very well globally – it has had no trouble crossing cultural, societal and language borders.
Additionally, the ten countries with the highest travelability are also geographically widespread, with Europe, Africa and the Caribbean represented.
However, the show seems to have the most appeal to the adjacent countries Greece and Macedonia, both of which have demand that exceeds even that of its U.S. market of origin. Denmark is the third country that also enjoys AFHV more than the show’s namesake country.
Let us now finish this analysis with a simple question: On the international stage, is America’s Funniest Home Video‘s performance “good”?
The Global Context: How good is good?
The Parrot Analytics demand distribution curve illustrates how a TV show’s popularity compares to our demand benchmark for all shows.
The curve is divided into performance buckets, ranging from “below average” to “standout”: A show falls into one of these performance buckets depending on how many times more or less demand it has, compared to the demand benchmark.
We have plotted four reality titles on this curve from the global top 20 discussed above and have also included Netflix’s Queer Eye and the historical drama Vikings for comparison:
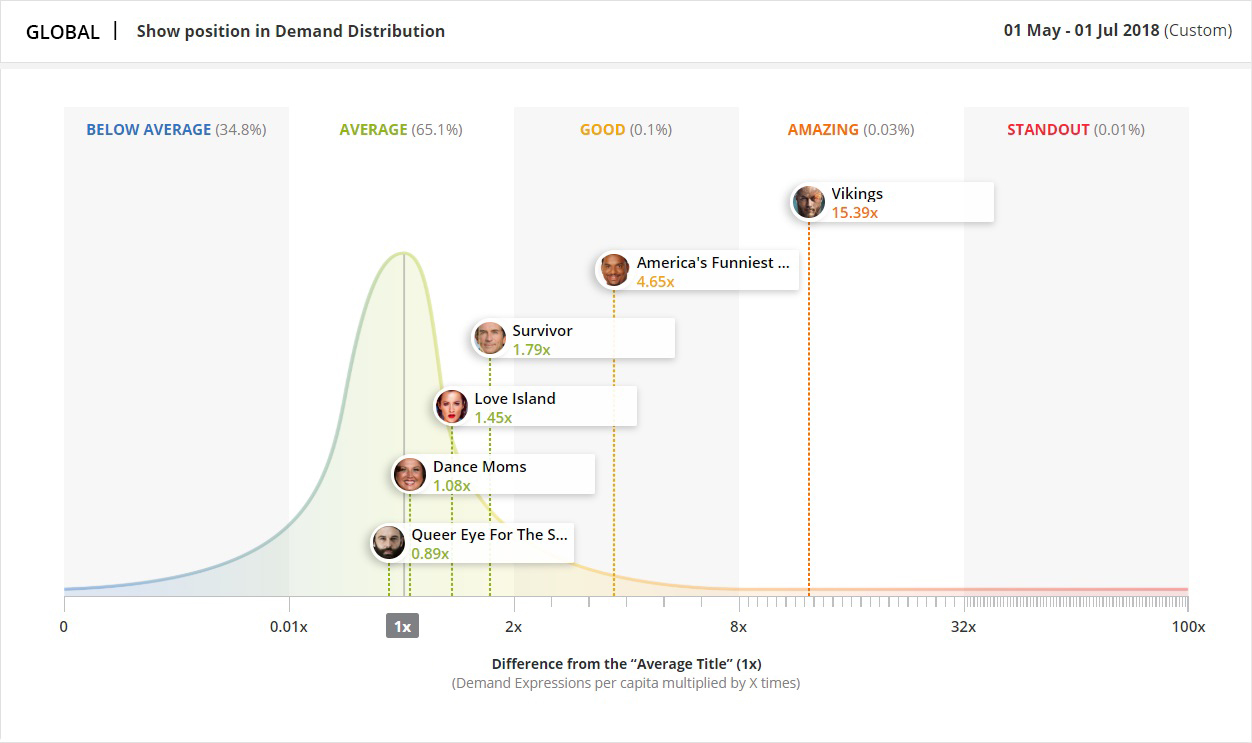
From our distribution curve it can be seen that AFHV is almost 5 times more popular than the demand benchmark. This certainly puts things in context and we would say it deserves to be labelled a “Good” show from a global popularity perspective. Only 0.1% of all shows reach this level of global performance.
For comparison, the historical drama Vikings has 15.4x more demand than the average title globally, which makes this an “Amazing” show; only 0.03% of all shows in a market reach this high level of demand.
For more information about trends in reality programming, please reach out to Parrot Analytics. You are also welcome to schedule a live demonstration of our Demand Portal, or watch our latest product video.