Image: Star Trek: Discovery, CBS All Access

Parrot Analytics’ weekly top 10 television charts are based on a weighted demand average that is empirically established (no panel-based surveys are used). Instead, our global cross-platform TV demand data incorporate various inputs such as peer-to-peer and streaming content data, fan and critic rating data, social media data and many more global data sources. 100+ markets are available for analysis using our software-as-a-service TV measurement system, based on actual audience activity and behavior. Let us now look at our cross-platform TV demand charts for the U.S. domestic market.
In the streaming chart, there have been many changes in the ranking as spring releases are well underway. The Act is heading into the homestretch, there are just two episodes of the series left, and – spoiler alert! – mercifully the murder of Dee Dee Blanchard was done off-screen in episode six.
This dramatic arc drove the Hulu limited series to No. 1. The true-crime anthology series enjoyed a 24.9% week-on-week increase, becoming the series with the second highest growth this week (Star Wars: The Clone Wars was the fastest growing series this week).
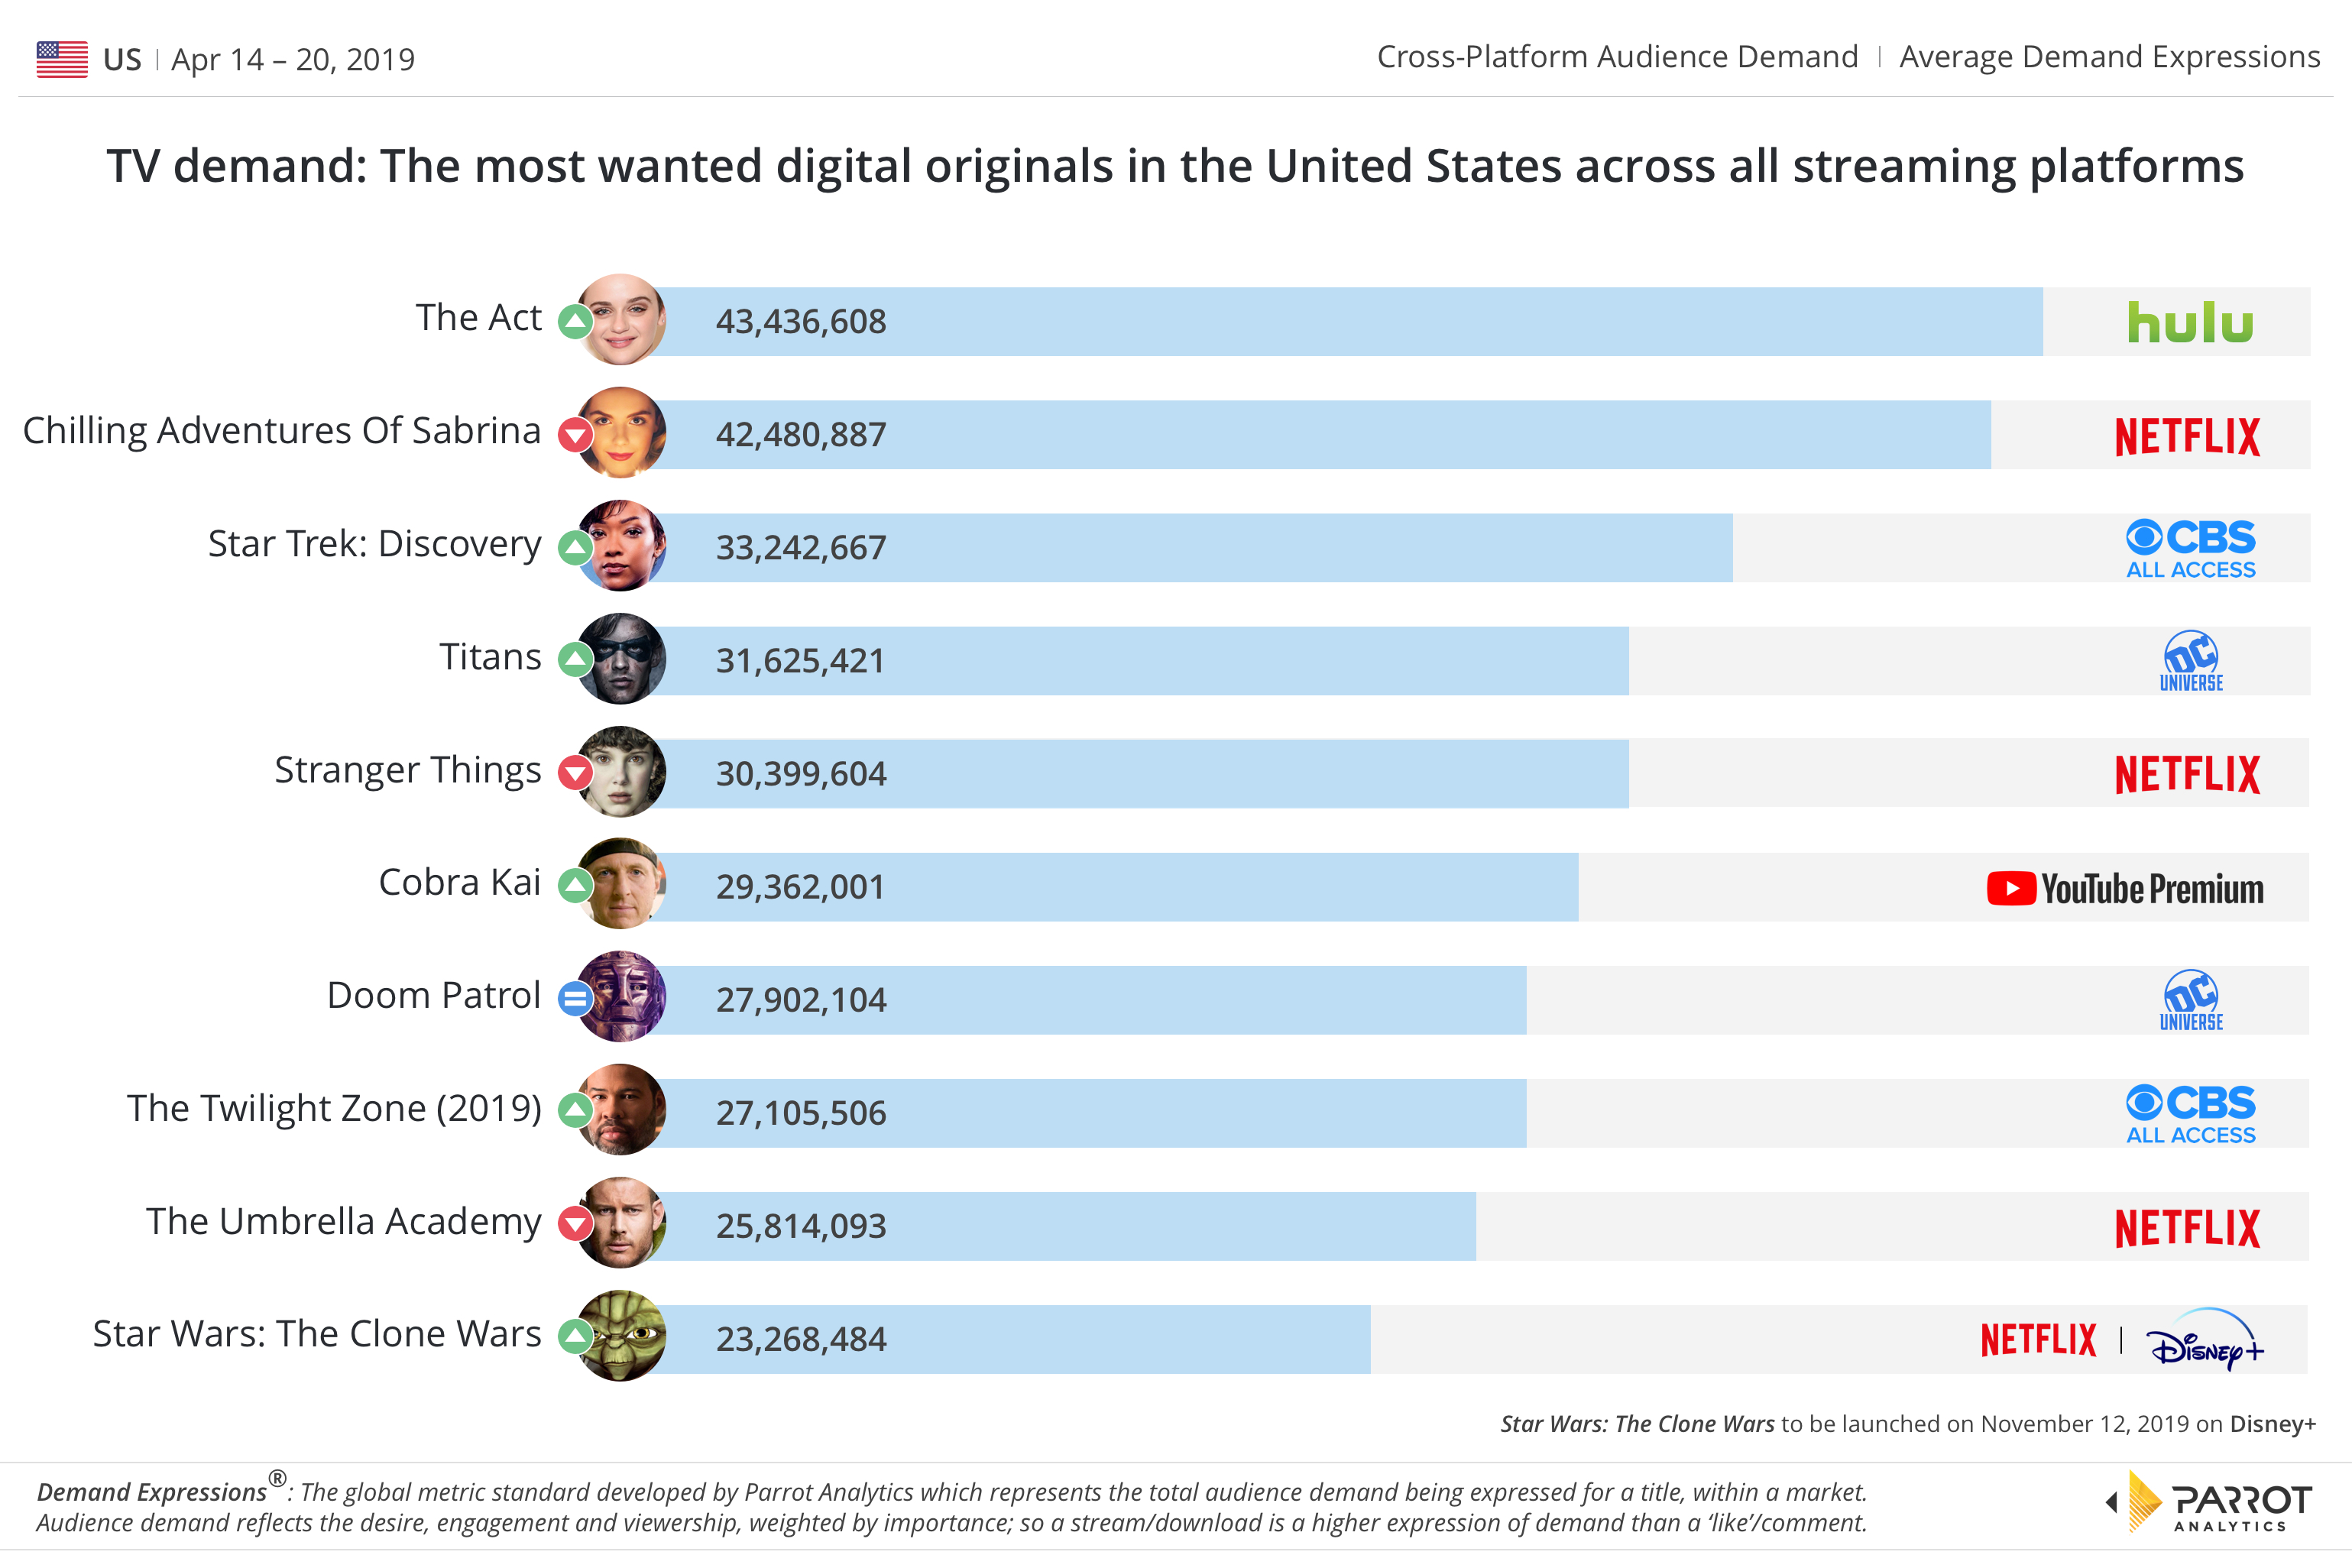
In other news, the second season of Star Trek: Discovery ended with a shocking twist, driving demand for the popular sci-fi series up by 10.1% week-on-week, pushing its rank up 6 places to number 3. Discovery will return for a third season on CBS All Access.
The other CBS All Access hit series – The Twilight Zone (2019) – is also in the top 10 as weekly episodes continue to drop. Audience reception for the reboot series has been positive, many praising Jordan Peele as the narrator.
Rounding out the chart is Star Wars: The Clone Wars, which hasn’t appeared in the digital chart since July 2018. Demand surged on the back of the beloved animated series announcement that 12 all-new episodes will be available on Disney’s direct-to-consumer streaming service Disney+, to be launched in the U.S. on November 12th. For now, the entirety of the series is on Netflix.
Last week, it happened an hour early, this week, it was just over six hours early: The second episode of the final season of Game of Thrones has been uncovered online in its entirety, through a third-party provider. Game of Thrones continues dominate as the “demand juggernaut”, with last week’s “Winterfell” setting a new record by breaking through the 500M daily demand barrier in the United States.
Season eight consists of just six episodes, as opposed to the usual 10, having been highly anticipated for nearly two years. Demand is expected to remain extremely high, and likely to increase further, as we continue moving towards the series finale on May 19th. Viewer speculation as to who will live, who will die, and who will ultimately “win” remains at fever pitch.
We have also observed other network series increase their demand (like The Flash, American Idol, and Brooklyn Nine-Nine) in the overall chart, possibly due to American audiences wanting to watch something lighter?