With technological advances changing the idea of TV from a fixed object in one room to something that can be enjoyed anywhere on a mobile device, TV is becoming more a part of everyday life, rather than something that must be planned and accommodated for. With this trend in mind, in our latest study we take a look at what else Americans do while watching television.
To discover the answer, we have commissioned a survey involving participation from 500 Americans, asking the following question: “While watching TV shows, what other activities are you commonly doing as well?”
As this was an open-ended question with no fixed answers to choose between, survey participants could list as many qualities as they wanted in their response. In analyzing the responses, a set of overarching categories were identified; the content of each individual answer was then assigned to the best fitting category or categories.
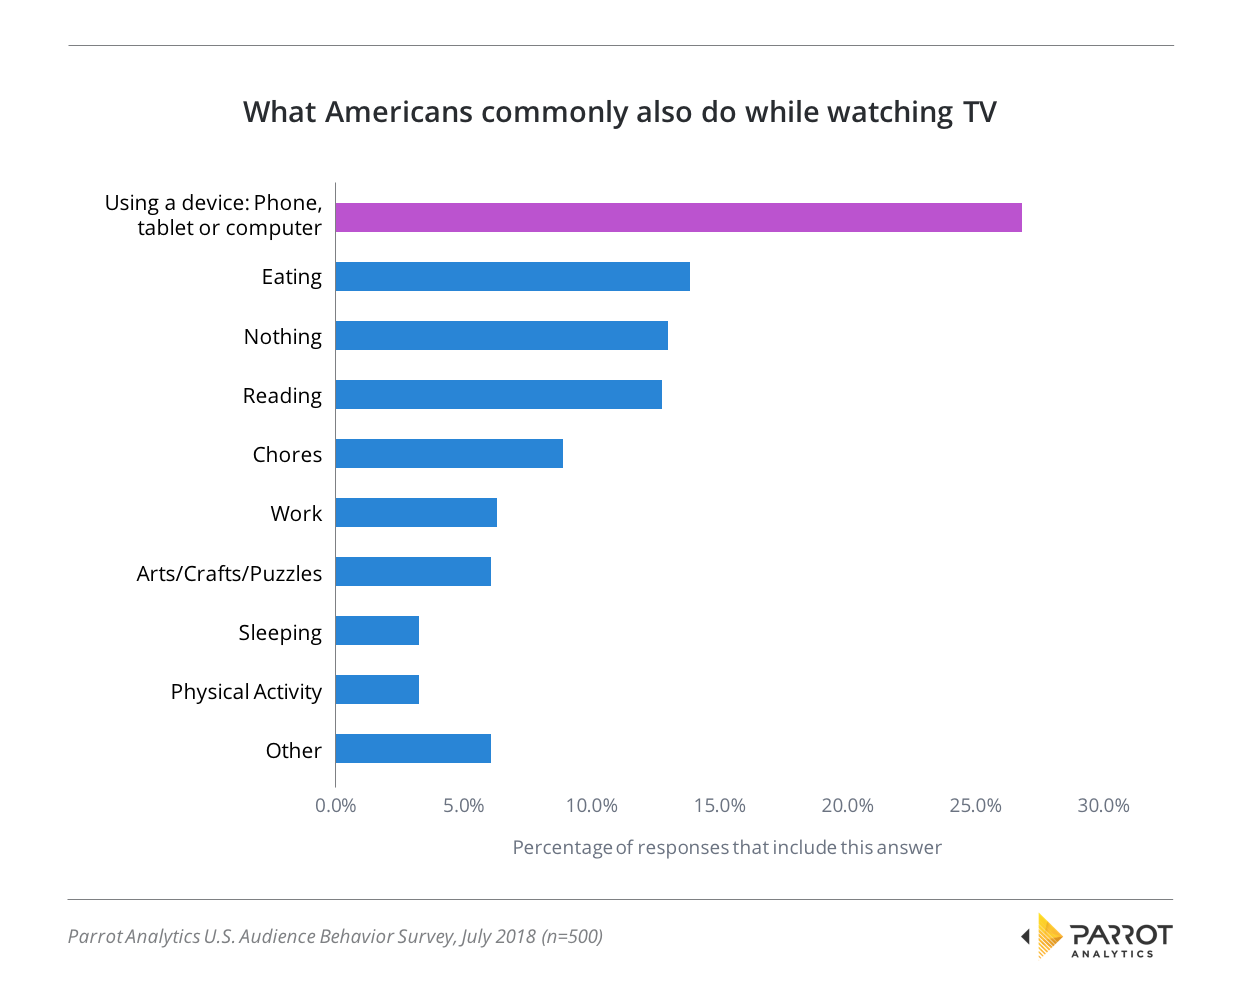
Many creators of TV series are creating great art: Brilliant and involved television that rewards viewers who pay close attention with compelling emotional stories that can’t be properly replicated in any other medium. In a heartening result for the creators of such shows, 13.0% of Americans are watching closely; these respondents answered that they do nothing else while watching TV.
However, these completely undistracted viewers are in a minority.
U.S. television viewers are distracted
26.8% of responses involved a phone, tablet or computer, for example. Using a tech device is by far the largest category of activities done while watching TV. We will break this category down into more detail later in the article.
The second most common activity was the 13.8% of respondents who said that they were usually watching TV shows while also eating a meal. This answer likely held higher prominence in the past, after all, some might say that America is the country that invented the TV dinner.
Here are some of our other findings:
- 12.7% supplement their TV show with reading. While most of these responses did not specify the nature of the reading material, those that did, mentioned newspapers, novels and magazines in that order of popularity.
- 8.9% of respondents use TV shows to liven up household chores like cooking and cleaning. Folding laundry in front of a good show was particularly frequently mentioned.
- 6.3% of respondents said that they put on a TV show while working or studying. Although very few chose to go into detail about this, it is easy to think of a few jobs where TV watching is possible – for example night watchmen.
- 6.0% of Americans like to keep their hands busy with arts, crafts and puzzles while watching TV shows. This category included a range of responses like sketching, painting and crosswords, but the largest group in this category included a variation on sewing, knitting or crocheting.
- 3.2% of Americans admitted that while they may start watching a show, they end up sleeping instead.
- At the other extreme, 3.2% watch TV shows while doing a physical activity like working out.
Finally, 6.0% answered with something that didn’t fit into one of the above categories. The “other” category included a variety of responses, but the most interesting subsets were the answers that said they use their TV time to bond with their family – and a handful of responses that said what they like to do while watching a TV show, is to watch a second TV show!
Diving deeper into the tech device use of Americans
26.8% of Americans answered that they use a tech device whilst watching television; the following chart provides more detail into what these respondents do on their device.
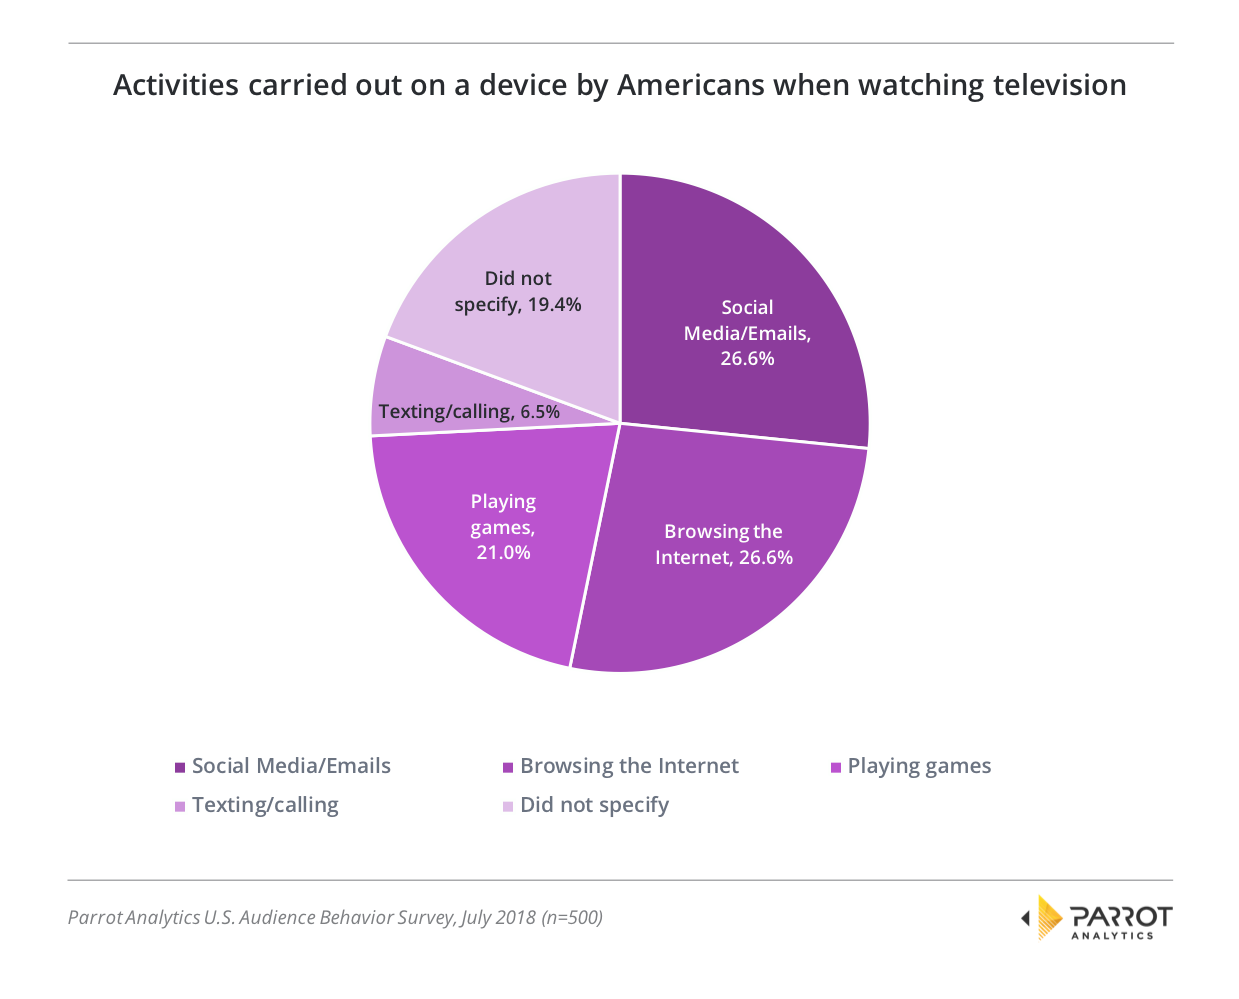
26.6% of the “Using a device” respondents said that they were primarily using it to check social media or emails while watching television. The most common social media site mentioned was Facebook, followed by Snapchat and Twitter.
The same percentage of respondents answered that they were browsing the Internet while also watching content on TV. The exact uses mentioned include online shopping and looking up details about the show being watched.
21.0% of device users said that they are playing a game alongside watching the TV show. The vast majority of these answers specified that they were playing a phone or tablet game, but a small minority were running a PC game as well as watching a TV show.
19.4% did not provide any details as to the exact form the device use took.
Overall, while only 13% of those surveyed were paying full attention to the TV show, Americans are not as distracted from their content as that number suggests: Quite a few of the activities brought up in our study like eating, folding laundry and knitting do not overly hinder active viewing of the show.
Where respondents provided answers where they would clearly be inhibited in their ability to pay attention to TV content, such as playing games and reading, one can speculate that these viewers may be primarily watching shows that facilitate their secondary activity. This is either because the title being watched is a repeat, or because some shows by their very nature make it easier to “dip in and out” in terms of paying attention: Where a fast-paced drama may leave viewers confused about the plot if a few minutes are missed, audiences will find it much easier to reorient themselves with the flow of a competition reality title, or a sitcom, after a few minutes of inattentive viewing.
As content fans ourselves we are hopeful that viewers are making the right choices to ensure they do not miss too many great scenes due to what else they might choose to do whilst watching.
For more information about audience trends in the United States, reach out to Parrot Analytics for a live demonstration our Demand Portal, or watch our latest product video.