Image: On My Block, Netflix
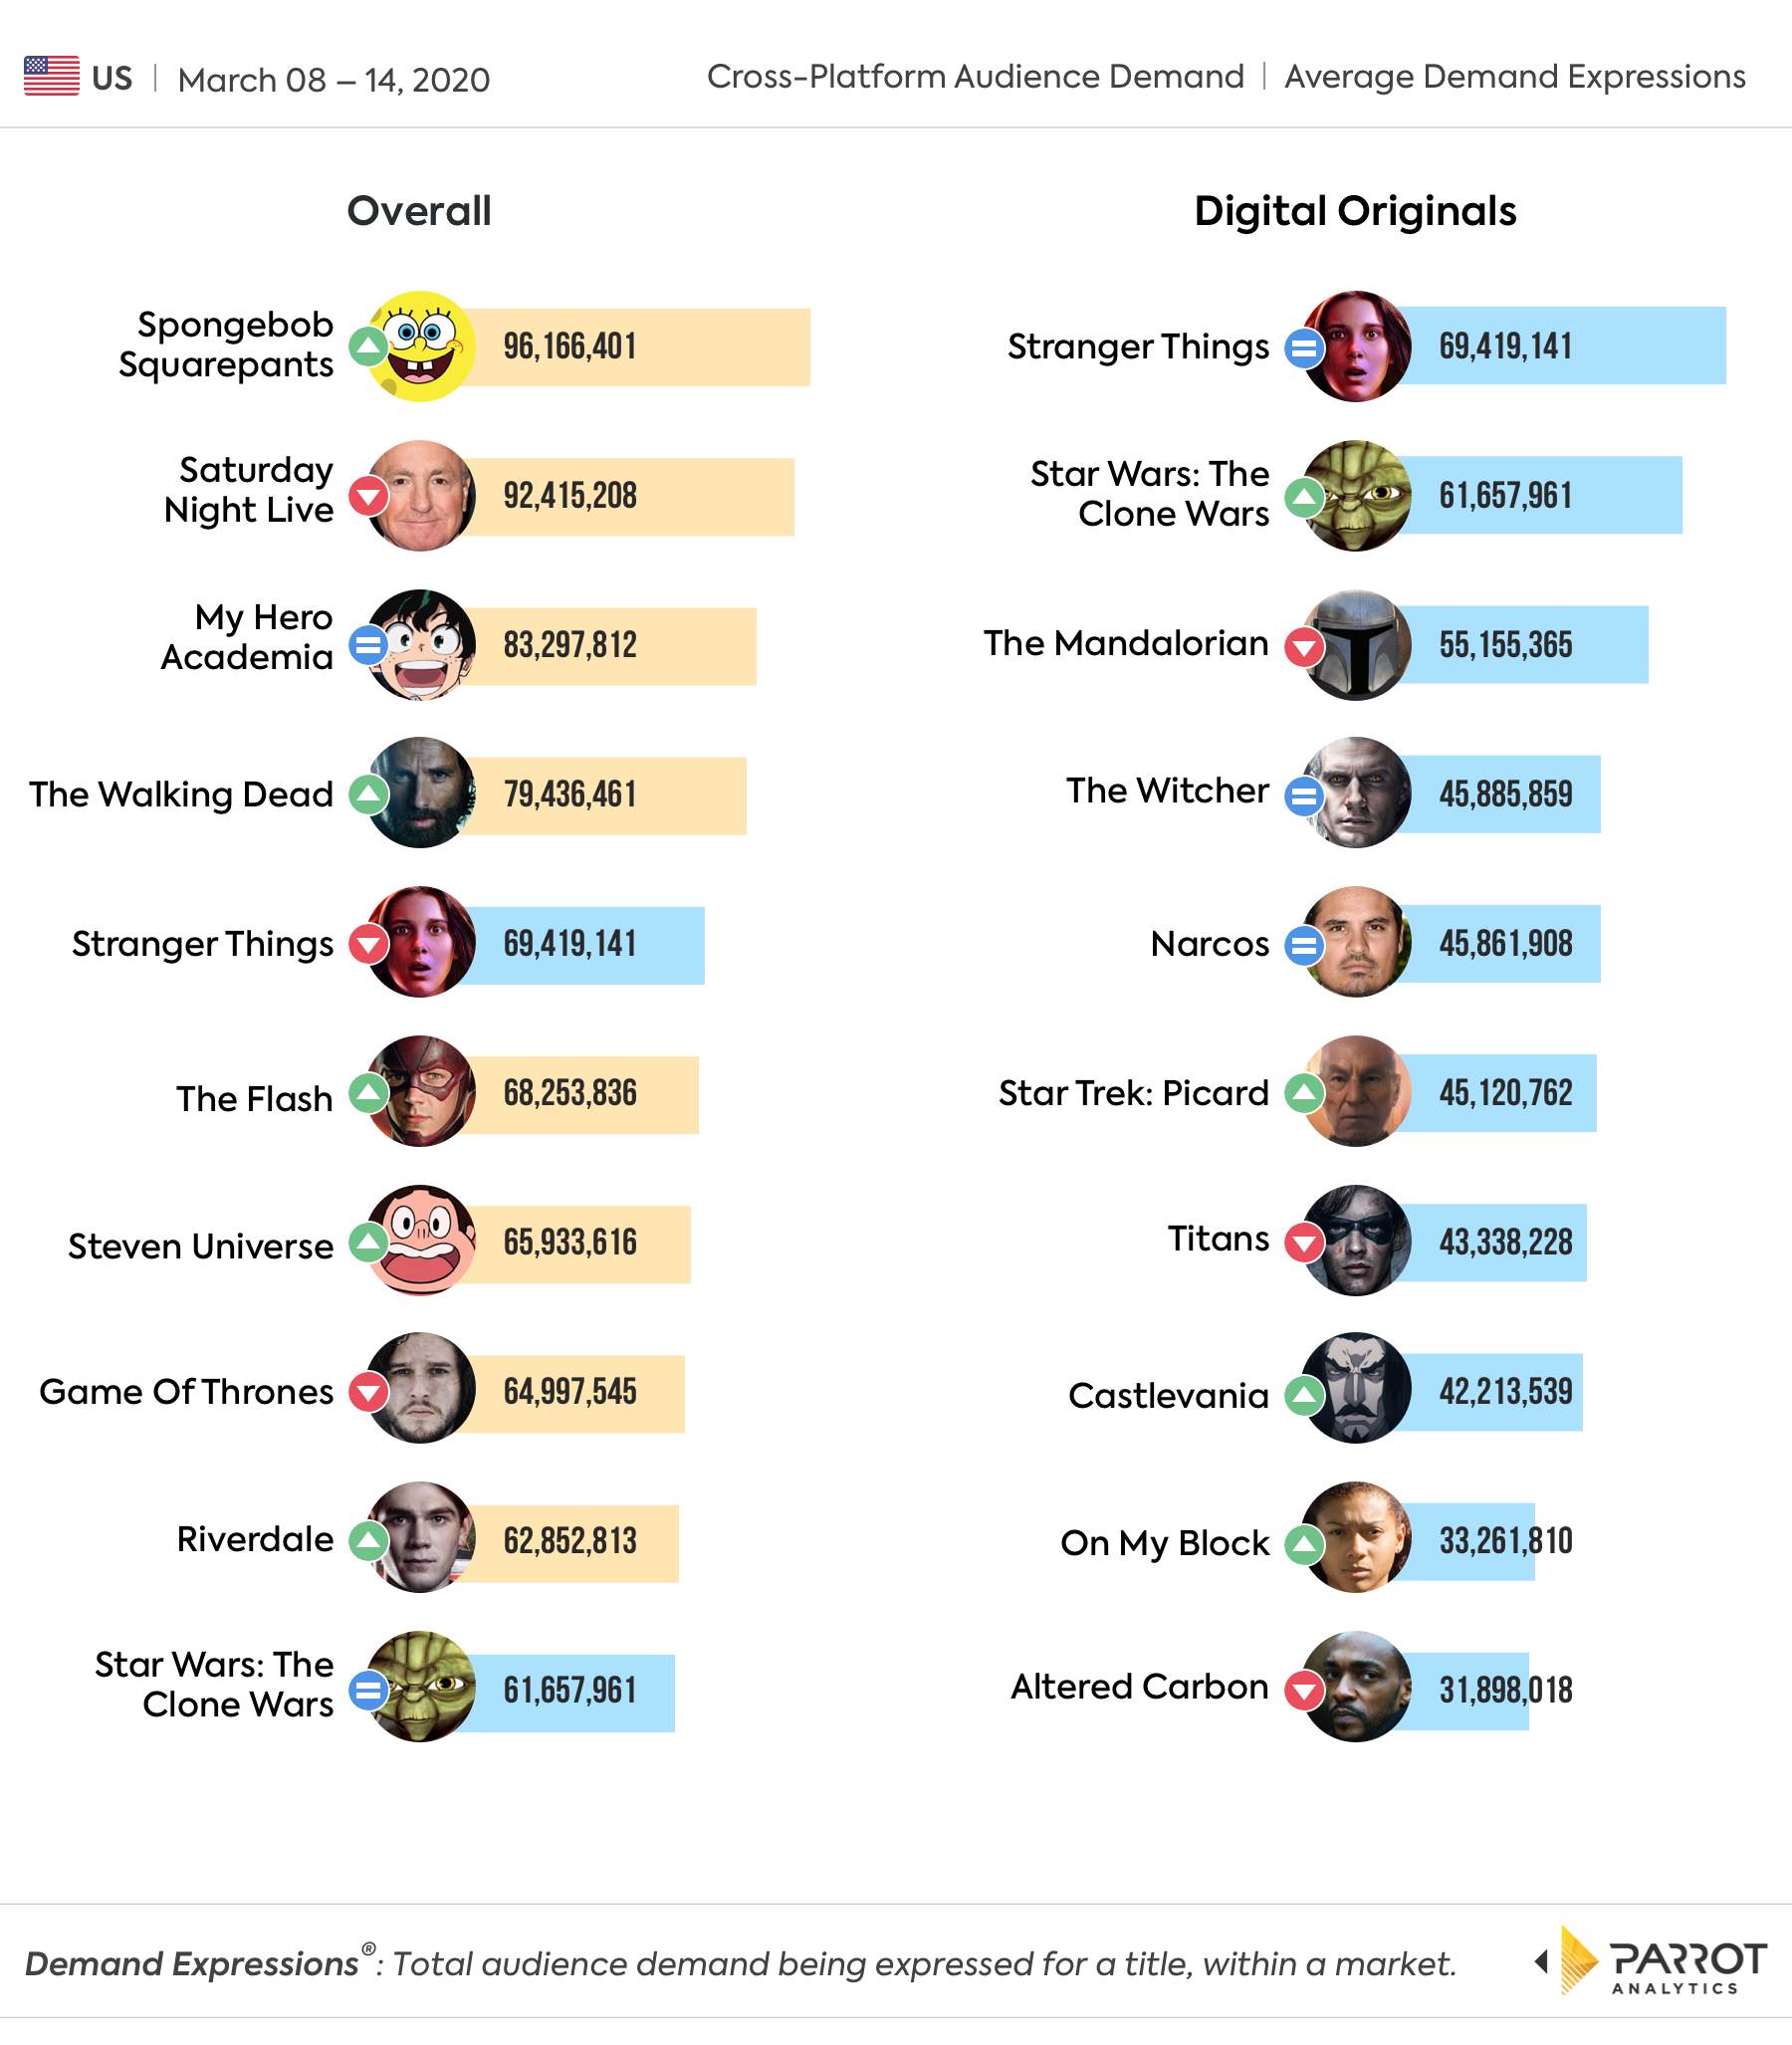
In the overall chart of TV series ranked by cross platform demand for the week of the 8th to the 14th March, 2020, NBC’s Saturday Night Live has been replaced as the top title in the USA. The sketch show has traded places with last week’s second most demanded series, Nickelodeon’s Spongebob Squarepants. While demand for both shows is generally stable, SNL dipped by 6.5% after last week’s high.
The highest increase in the overall top ten is AMC’s The Walking Dead, which grew in demand by 19.7% since last week. US demand for the horror series has grown since Season 10 resumed airing on 23rd February.
The CW’s Riverdale also had a good week, moving into the top ten in 9th place from last week’s 12th. This is largely driven by the currently airing Season 4, with this week’s episode resolving a multi-episode murder mystery arc. However, the drama was also impacted by global current events: It was reported this week that production on Riverdale has been halted due to potential coronavirus exposure among the crew.
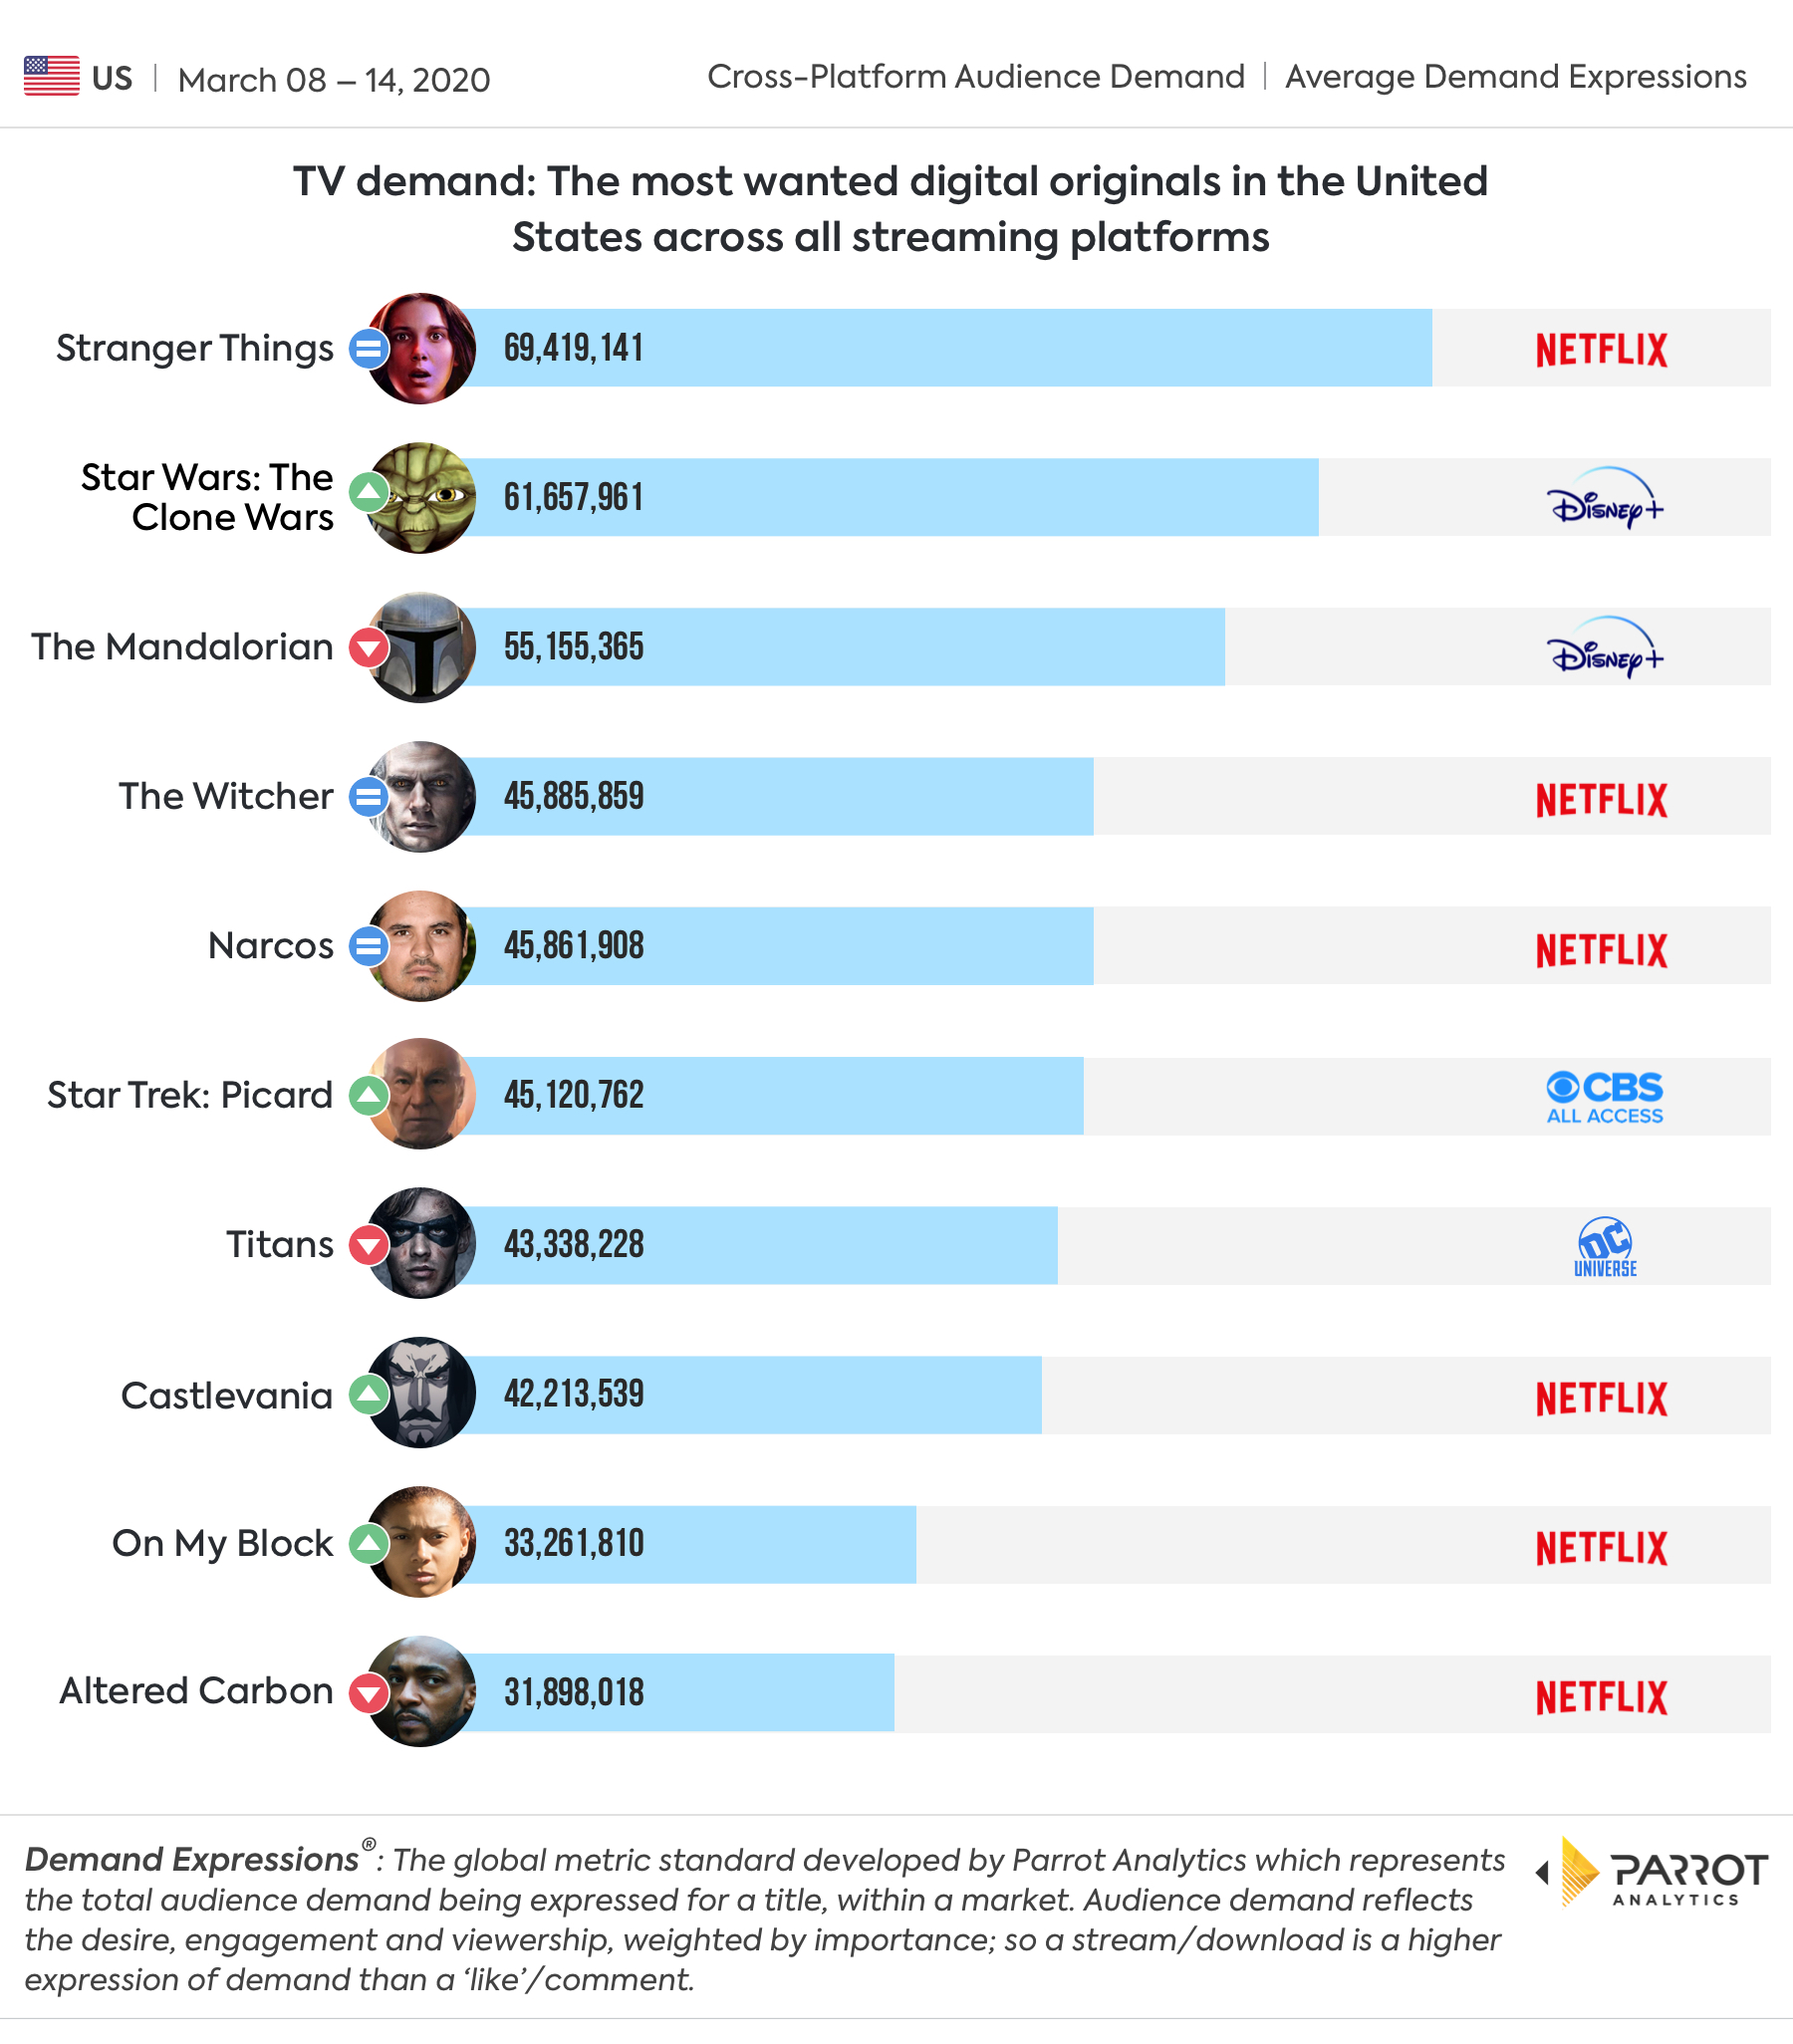
The very top of the US digital original charts remains the same as last week. The top SVOD original series by US digital television demand is Netflix’s Stranger Things. Making up the rest of the top three is Disney+’s Star Wars series. The currently airing Star Wars: The Clone Wars rises to second most in-demand series, while The Mandalorian is now third.
We have a returning entry in the digital original top ten in the form of Netflix’s On My Block. The teen drama has entered the top ten for both previous seasons, peaking at second each time. Season 3 of the show was released on 11th March. This prompted a 39.2% digital television demand increase from US audiences, moving the On My Block from 16th to 9th most in-demand digital original. The show has been praised by critics for its realistic and diverse take on inner-city teen issues.
A second returning entry to the US digital original chart is Netflix’s Castlevania. Season 3 of the animation was released on 5th March. Digital television demand for the show rose by 71.4% after this, raising it from 13th to 8th in the USA. Castlevania reached top ten status on the digital original chart for the release of both previous seasons, peaking at no. 1 for Season 1 and no. 5 for Season 2. Although the series has not quite reached those heights yet, demand may yet rise on the back of Season 3’s very positive critical and audience reviews.


