By reading this article you will understand:
- How to use a demand vs. supply analysis to understand trends in audience content demand against industry supply for micro-genres.
- Which micro-genres are most represented in the available series in the United States, which are best at attracting audience attention, and which have the biggest gap between these two – representing either an opportunity or a warning.
- How these trends are shifting and what is audience attention moving towards.
Parrot Analytics supply and demand trend reports reveal trends in audience content demand against industry supply for microgenres. Series usually belong to multiple microgenres within an overarching main genre, for example Star Trek: Discovery is a drama series that has the action and science-fiction microgenres.
In this report, we look at which microgenres are most represented in the available series in this market, which are best at attracting audience attention and which have the biggest gap between these two – representing either opportunity or warning. Lastly, how are these trends shifting and what is audience attention moving towards?
The key questions investigated in this report:
1. What does the content landscape look like in the United States?
2. Where are the largest whitespace opportunities in the United States?
3. Which genres are trending towards increased whitespace in the United States?
What does the content landscape look like in the United States?
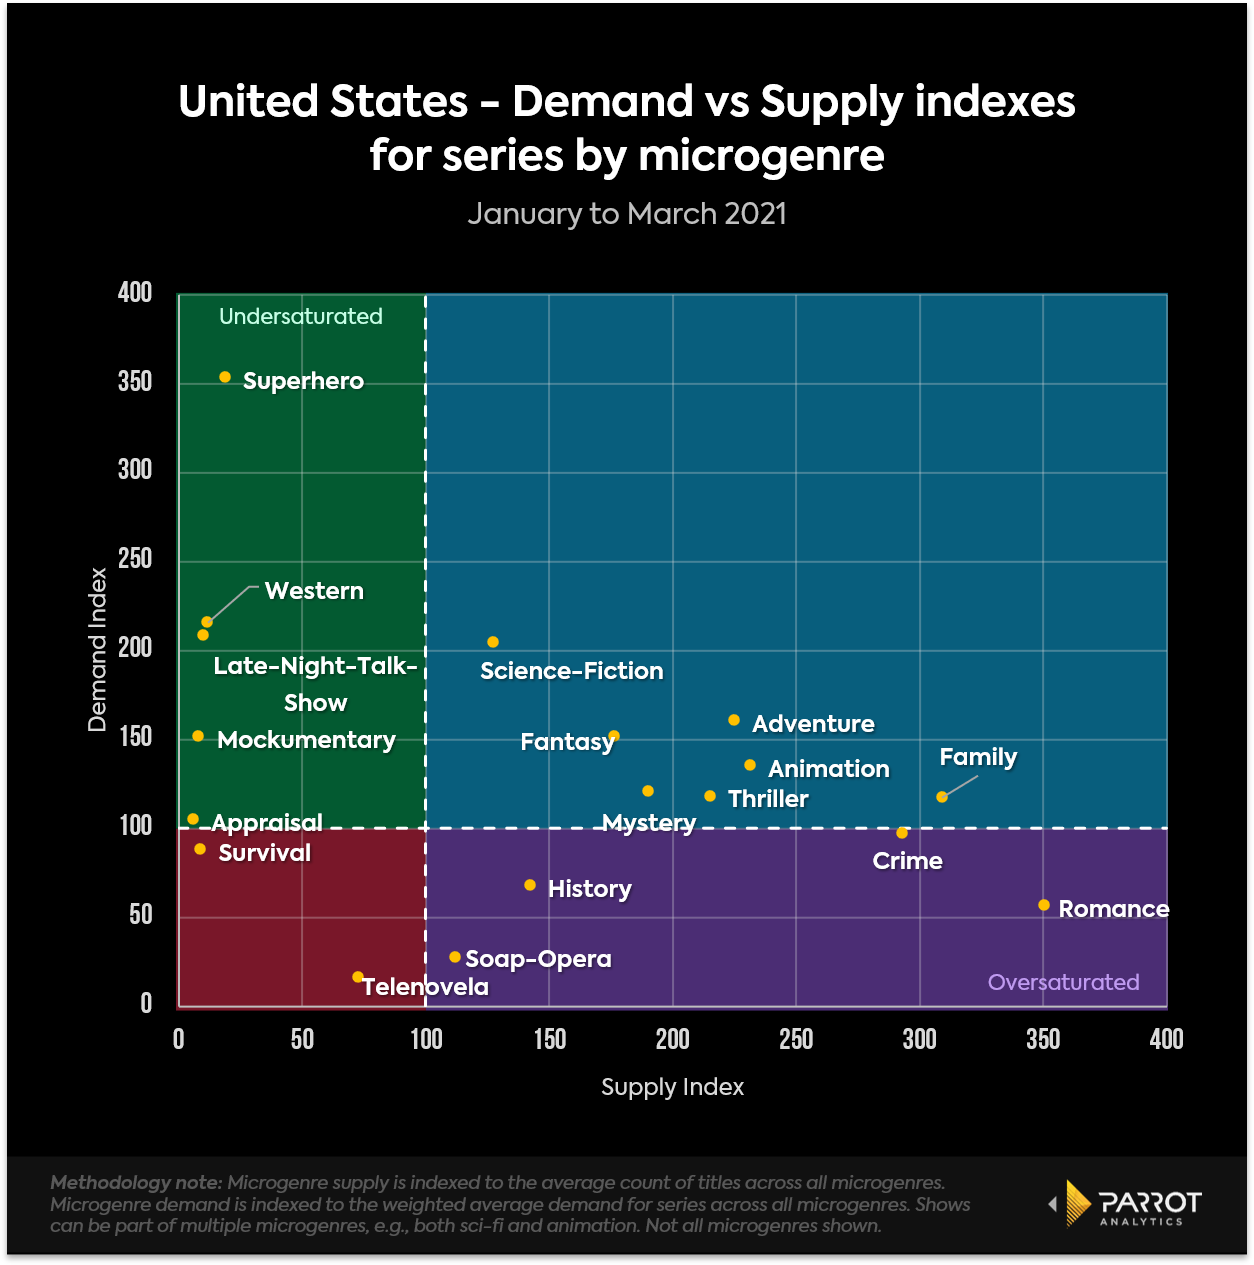
• This chart shows how the supply and demand compares for each microgenre in the US to reveal content opportunities.
• One of the most undersaturated microgenres is superhero series. The typical superhero series has around 3.5 times the demand of the average series in a microgenre, but there are about 80% less titles in this microgenre than average.
• Late night talk shows and paranormal series also sit in this high demand but low supply region.
• Conversely, other microgenres are oversaturated in this market. Romance series have a high level of supply, containing 3.5 times as many series as the average microgenre. However, the typical romance series only has about half of the average demand, making the microgenre the most oversaturated in the United States.
• The sci-fi and fantasy microgenres both sit around the equilibrium line. Both have more than the average amount of titles, but the typical series in one of these genres has more demand as well.
Where are the largest whitespace opportunities in the United States?
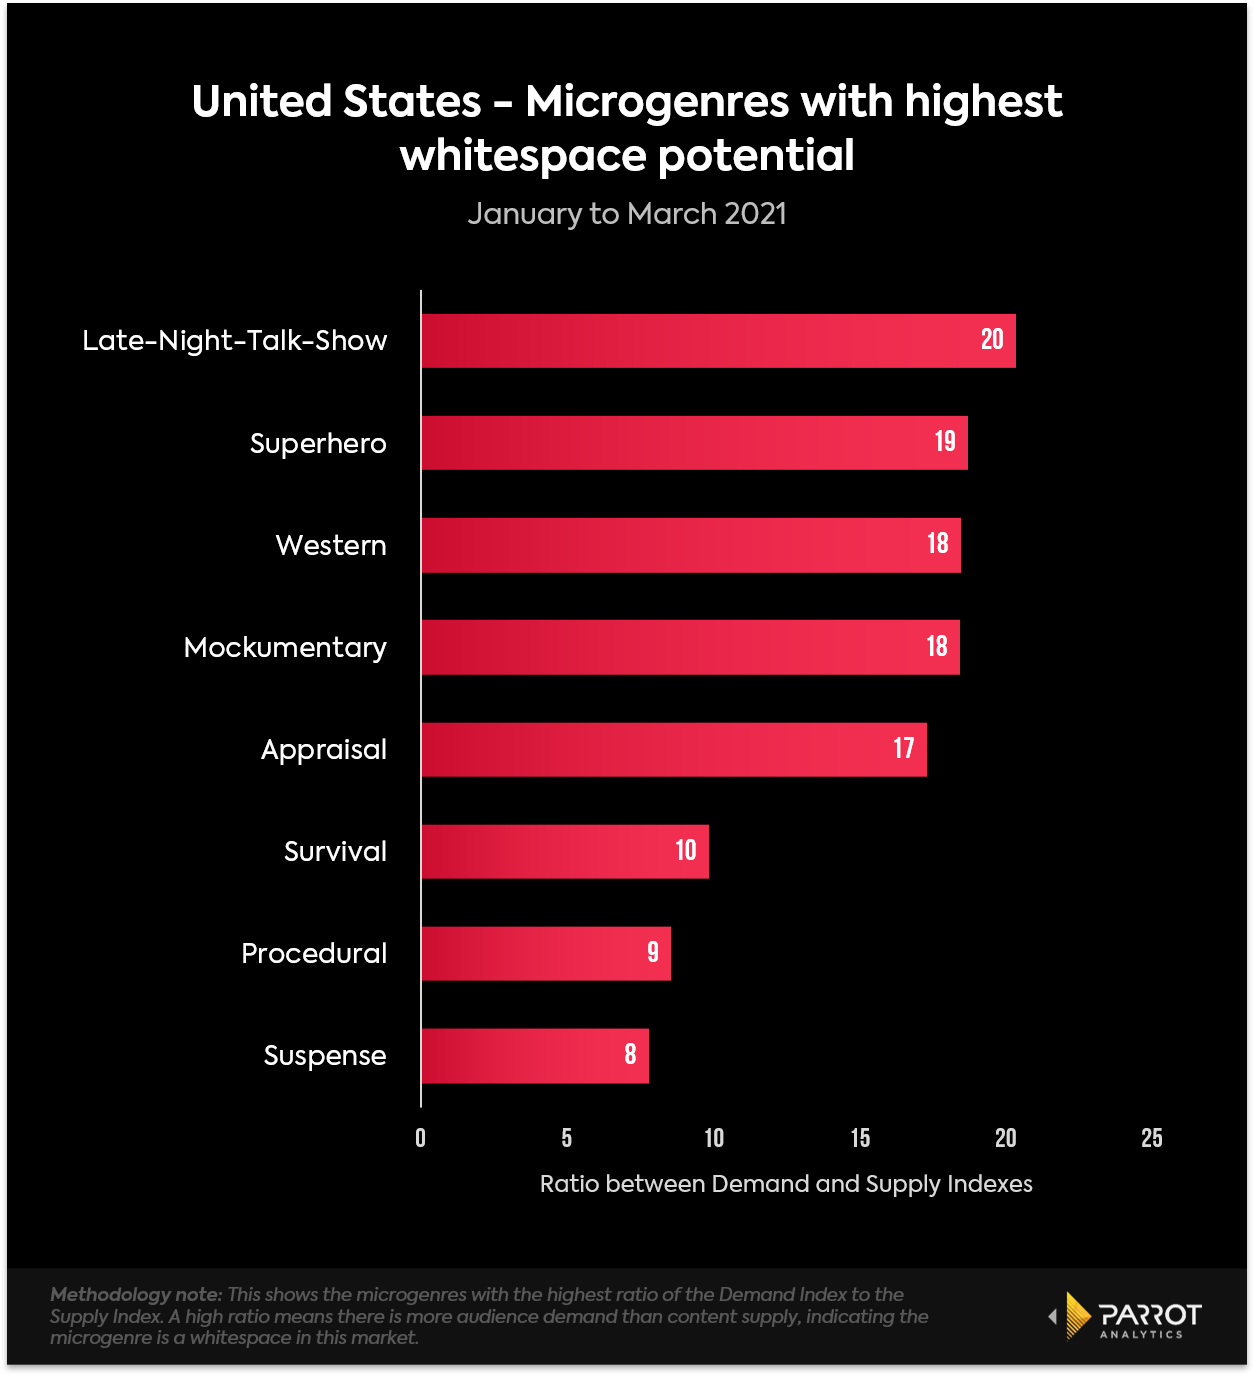
• For the United States between January to March 2021, late night talk shows have the greatest whitespace potential. Compared to all microgenres, late night talk shows have around 10% of the average number of titles, yet the typical late night talk show has slightly more than double the average demand.
• While it is difficult to incorporate late night talk show elements into other formats, producers of scripted series can observe that suspense and survival elements are desired by US audiences, but few shows currently supply this demand.
• Superhero and western series are another whitespace opportunity. The demand/supply ratio for these microgenres is similar to late night talk shows.
• While large-scale trends are not a guarantee of individual success in the US market, it is less risky than average to produce or acquire shows that are in (or incorporate significant elements of) these microgenres.
Which genres are trending towards increased whitespace in the United States?
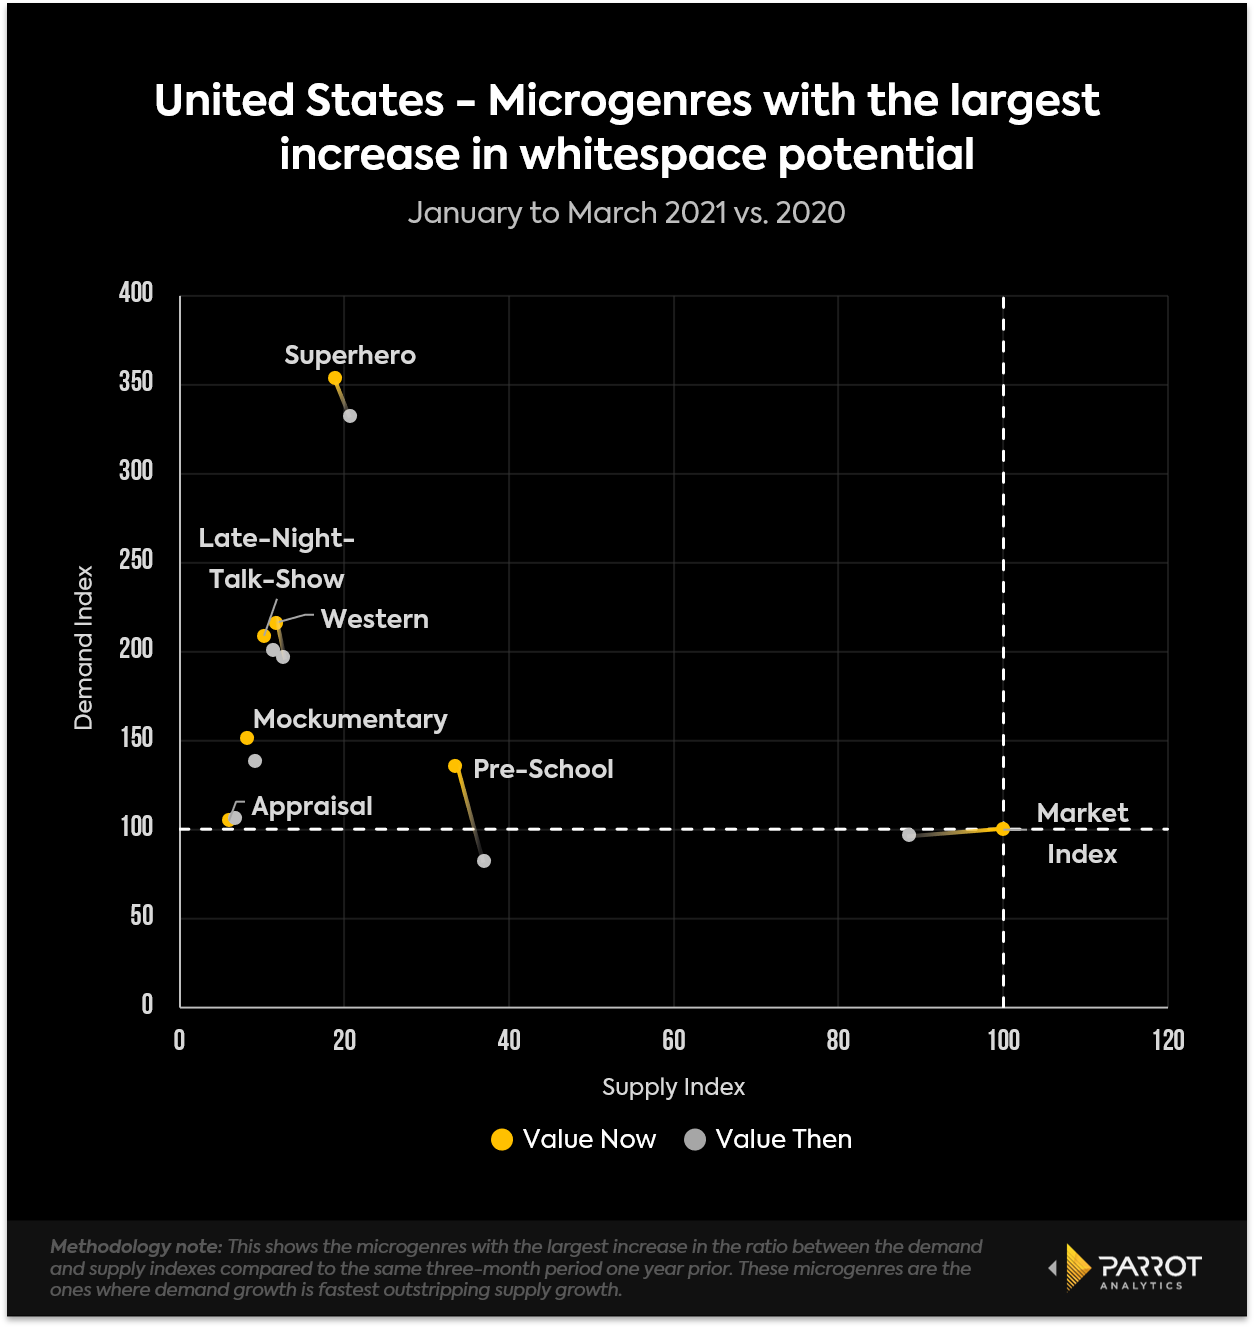
• US interest in mockumentary content is growing much quicker than the supply of titles in the microgenre. Compared to January to March 2020, the mockumentary microgenre added much more demand than supply.
• The main factor driving the larger whitespace for pre-school content is higher audience demand. The Demand Index is now 34% higher than the average demand for a title in a microgenre while last year, it was around 20% below average.
• The increase in whitespace potential for these types of content was helped by slow increases in number of titles. For all the microgenres shown here, their supply index shrank from last year: the average microgenre (shown on the chart as the Market Index) grew faster than these specific microgenres did.
This report is intended as a high-level overview of supply and demand trends in this market. DEMAND360 Enterprise users have access to a dedicated supply and demand analysis tool enabling insights into trends for specific platforms, title filters, custom timeframes and more in the Demand360 platform. To unlock access to these features, enquire about Enterprise subscription details here:
https://www.parrotanalytics.com/contact.
For more information, check out the most up-to-date United States television industry overview.


