By reading this article you will learn:
- How demand is a key driver in converting individuals to become subscribers of streaming platforms and how that is expressed across the global markets.
- How measuring the demand share of originals and the decay of demand can be combined to predict whether or not media giants will beat or miss their quarterly estimates.
- How Parrot Analytics’ decision models enable predictions with an accuracy of around 90%, providing a strong indicator of success - or failure - on Wall Street.
Nowcasting Netflix Net Subscriber Additions
Director of Applied Analytics Alejandro Rojas was invited to showcase global TV demand data at BattleFin's Virtual Discovery Day, themed Technology x Media x Entertainment, presented by AWS.
Whilst contributing to BattleFin's panel, held in mid 2021, Mr Rojas demonstrated how Parrot Analytics' TV demand data can be leveraged from an investor's perspective, using Netflix as a case study. In doing so, he answered the following question for panel attendees: "Is Netflix going to meet their net subscriber addition guidelines?"
Demand drives subscribers
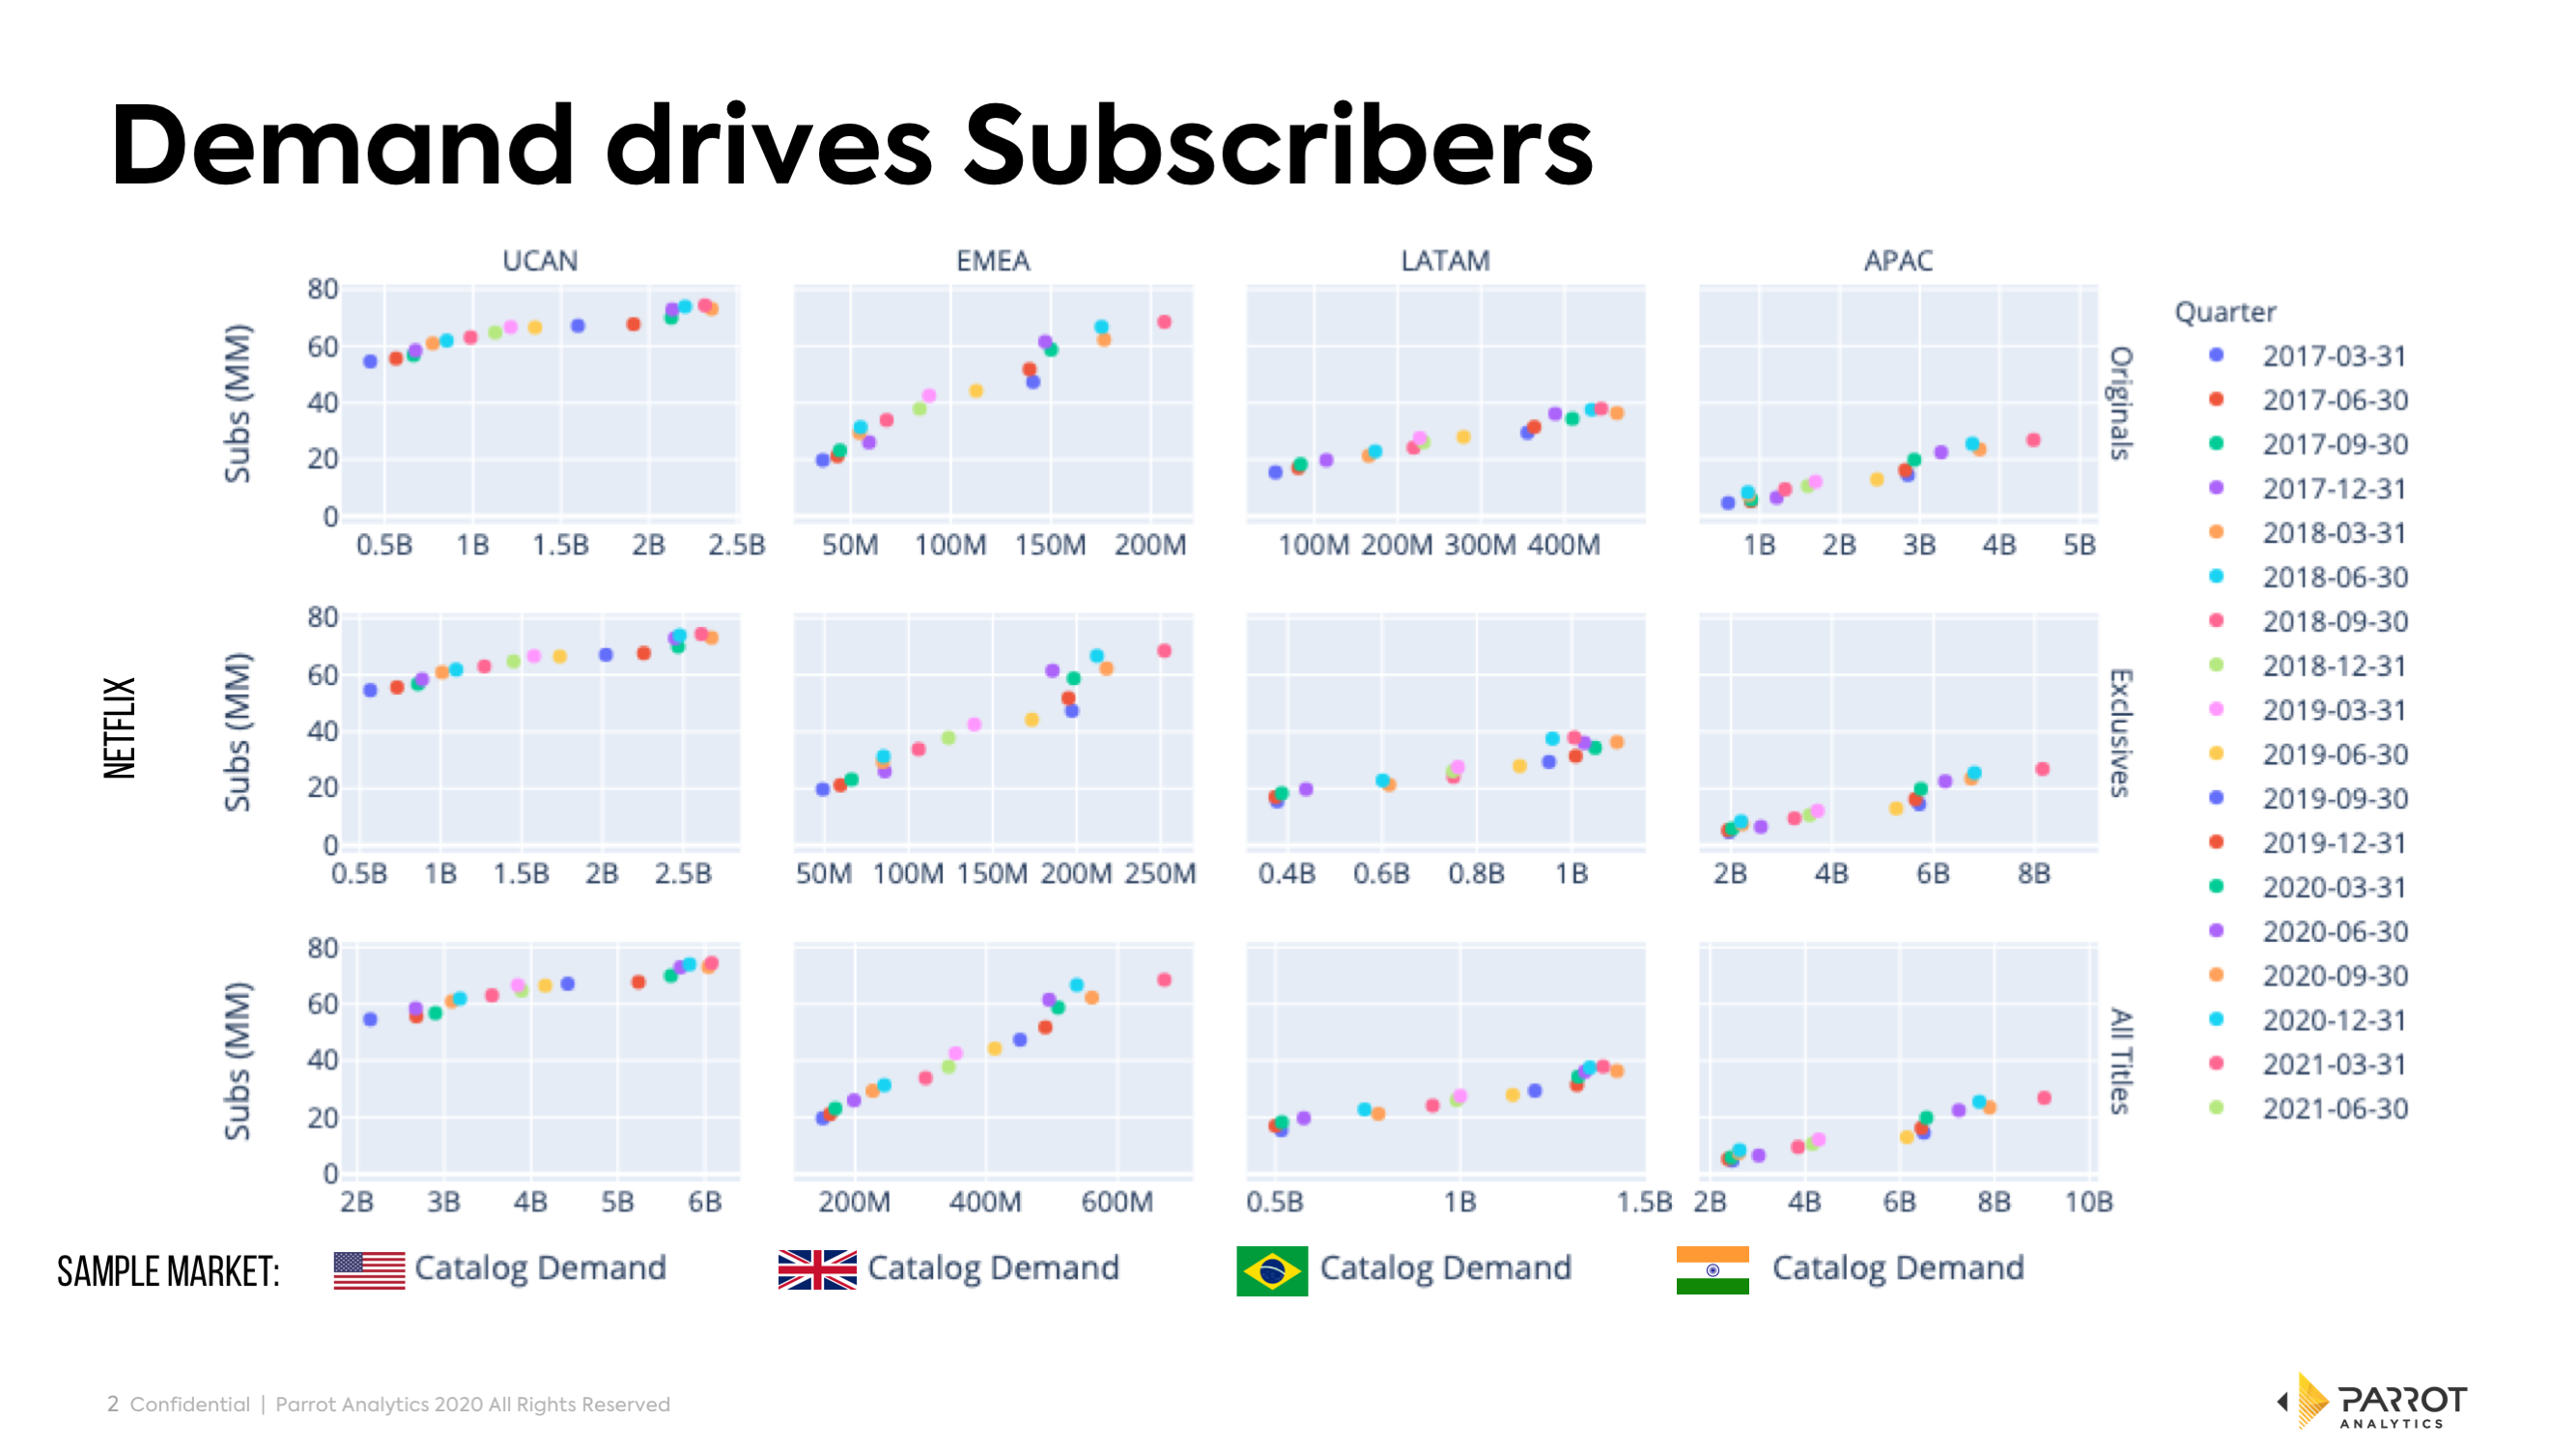
Demand is a key driver in converting individuals to subscribers: In the graph below, we showcase global demand for TV shows in regions that Netflix defines, such as UCAN, EMEA, LATAM and APAC. The vertical axis depicts the number of Netflix subscribers, while the horizontal axis depicts our core metric - audience demand.
In the top row, for example, we showcase the demand for all Netflix original content over time and compare that against subscribers. We see a strong correlation in this case. When we carry out the same analysis for exclusive licensed content (middle row), a similar correlation emerges. Finally, in the bottom row, we track the demand for all titles in Netflix's catalog over time.
It is important to note that this chart is a representative sample, and can be replicated across hundreds of countries. We track audience demand daily which can be easily rolled up for a quarter.
Demand serves as an indicator of how many subscribers a platform might have or gain in that quarter. Therefore, this dataset can be leveraged to understand if Netflix is going to meet its subscriber addition guidance - or not.
Demand metrics anticipate the earnings beat
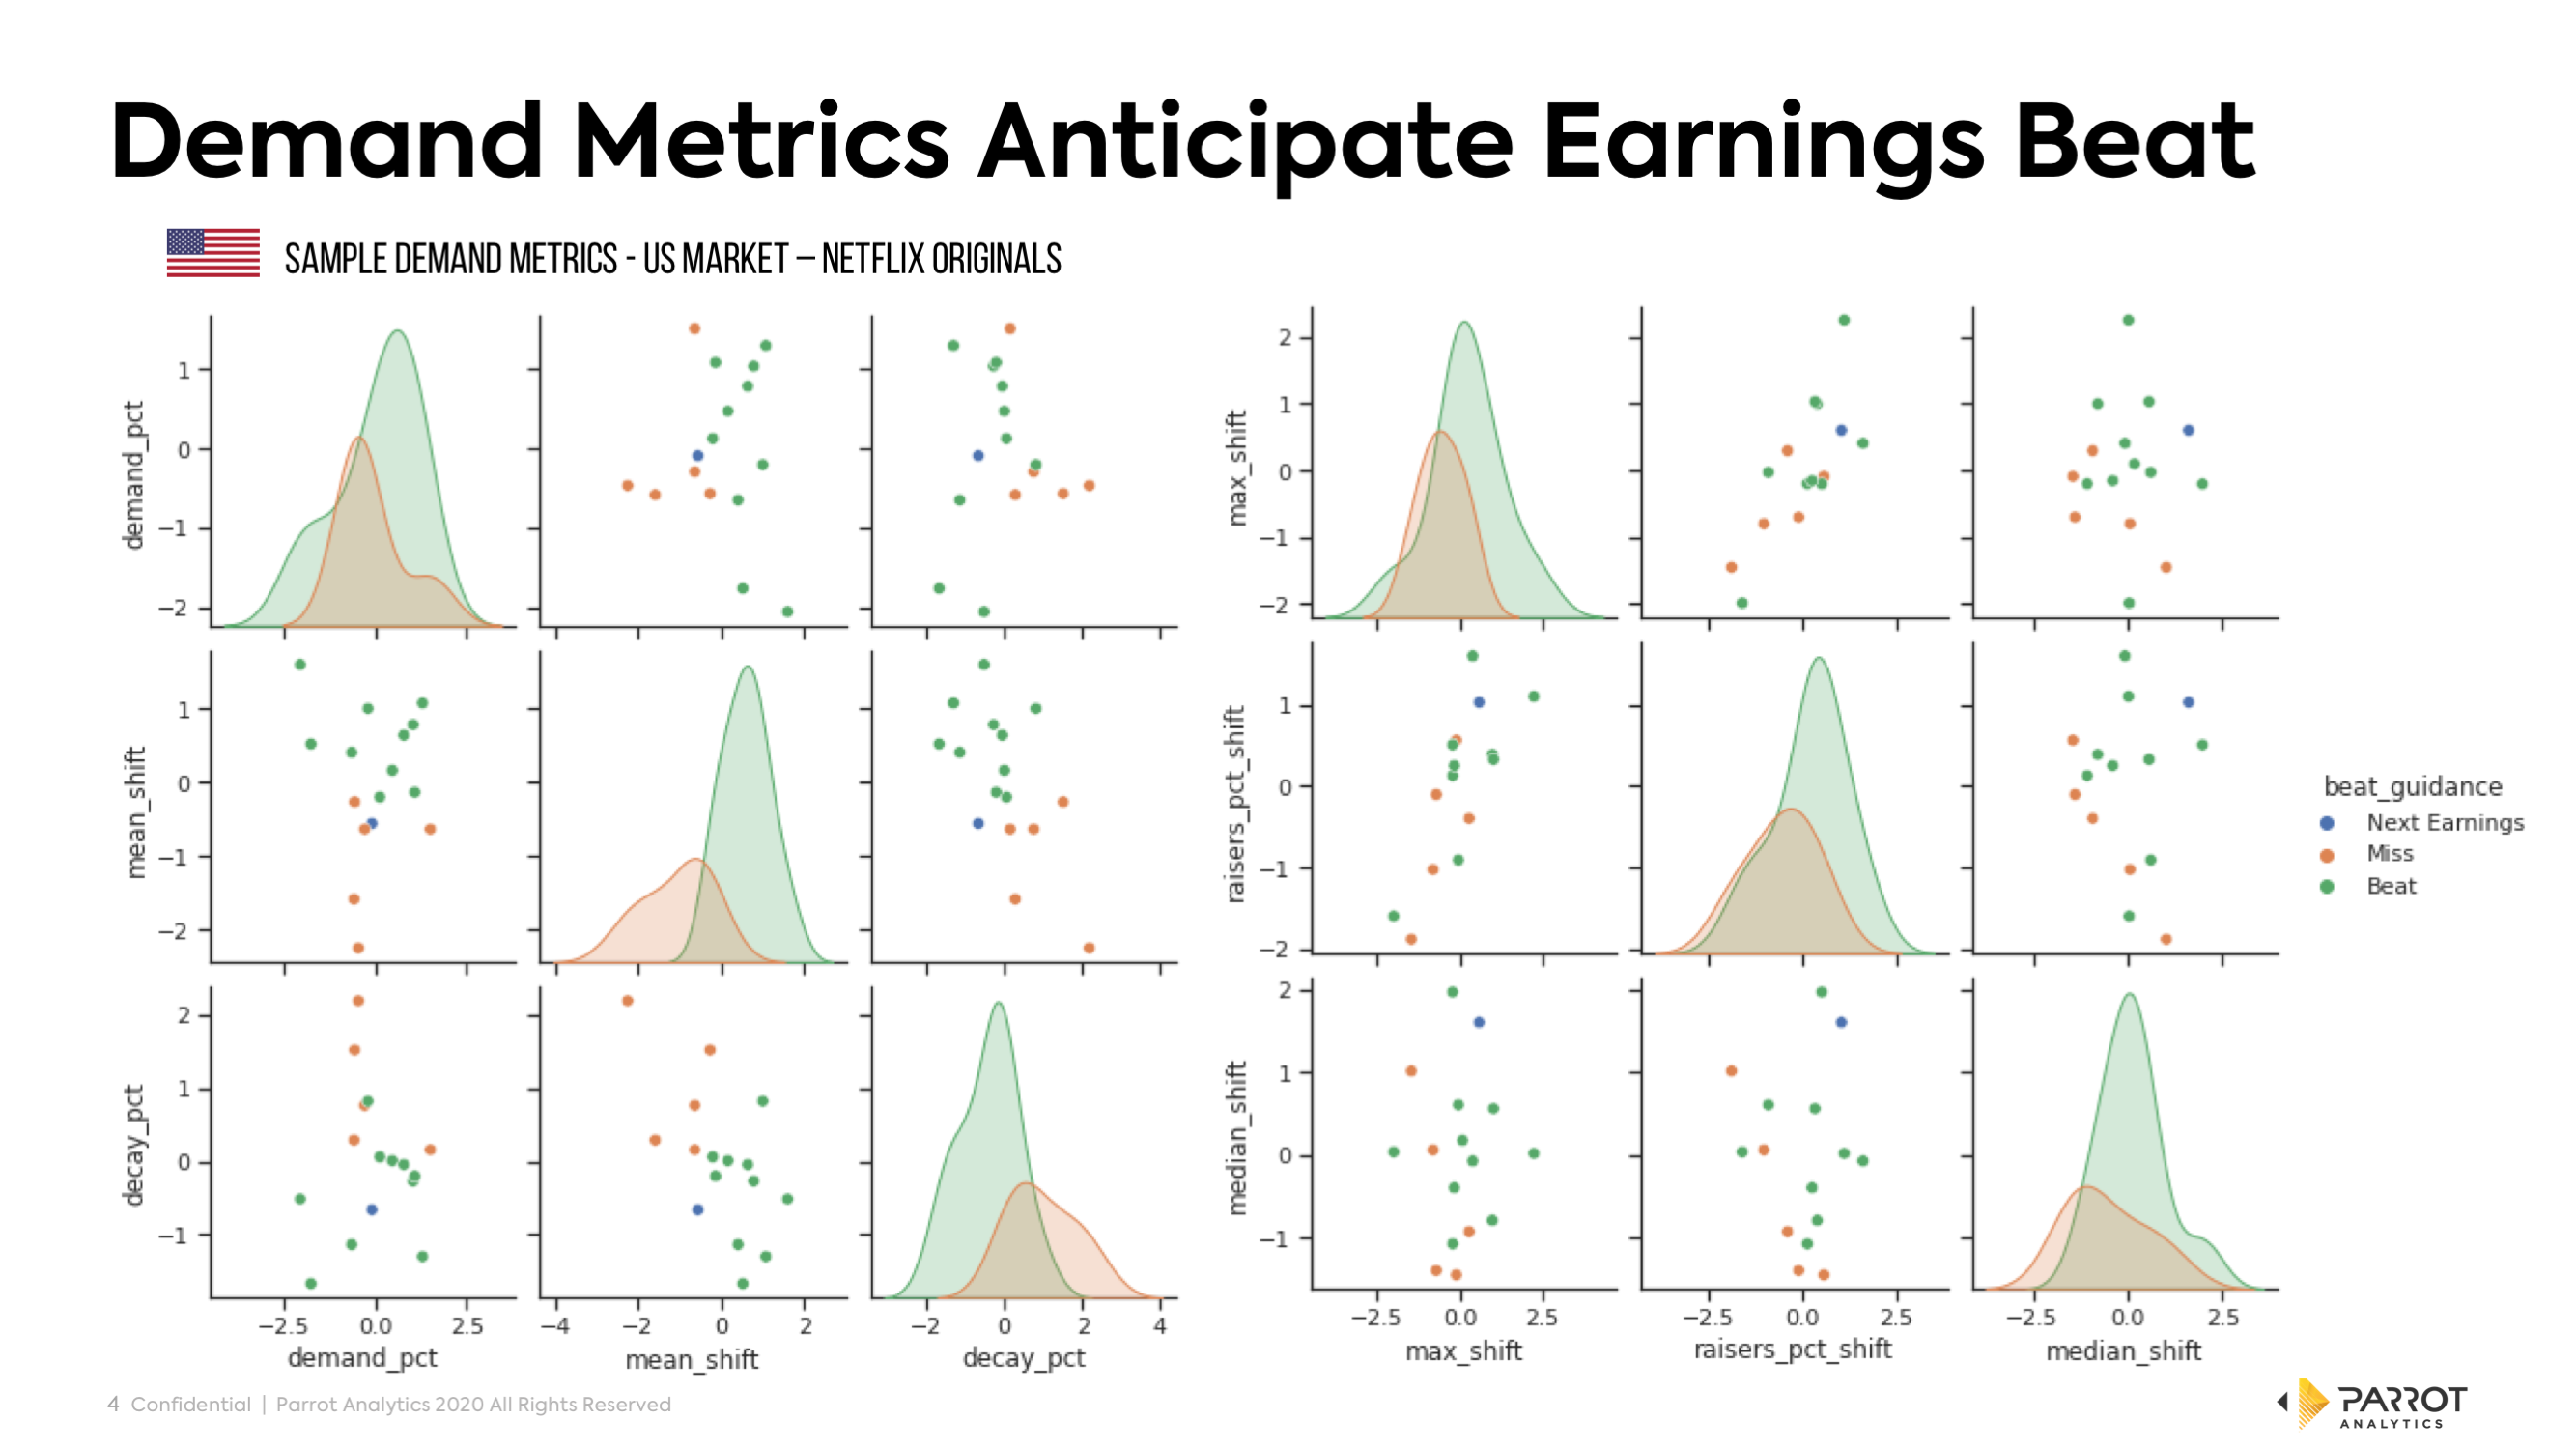
In the next chart below, by analyzing the US demand for Netflix digital originals only, we can measure the demand share of Netflix originals in terms of the total demand in the direct to consumer market. Decay refers to how much audience demand declines over the quarter.
These two metrics can then be combined to analyze when Netflix might beat their estimates and when they miss. Another metric we look at is the mean shift, which means the average demand for the total catalog.
This is an example of how a number of our industry-leading metrics can be used to create decision models that enable prediction with very high accuracy (~90%) - whether Netflix will beat its subscriber additions guidance or not, allowing us to anticipate what to expect on the earnings date.
Demand applicable to Netflix and beyond
The same metrics that have been used for Netflix can be used for other streaming platforms, enabling investors to predict if other streamers are going to meet their numbers or not.
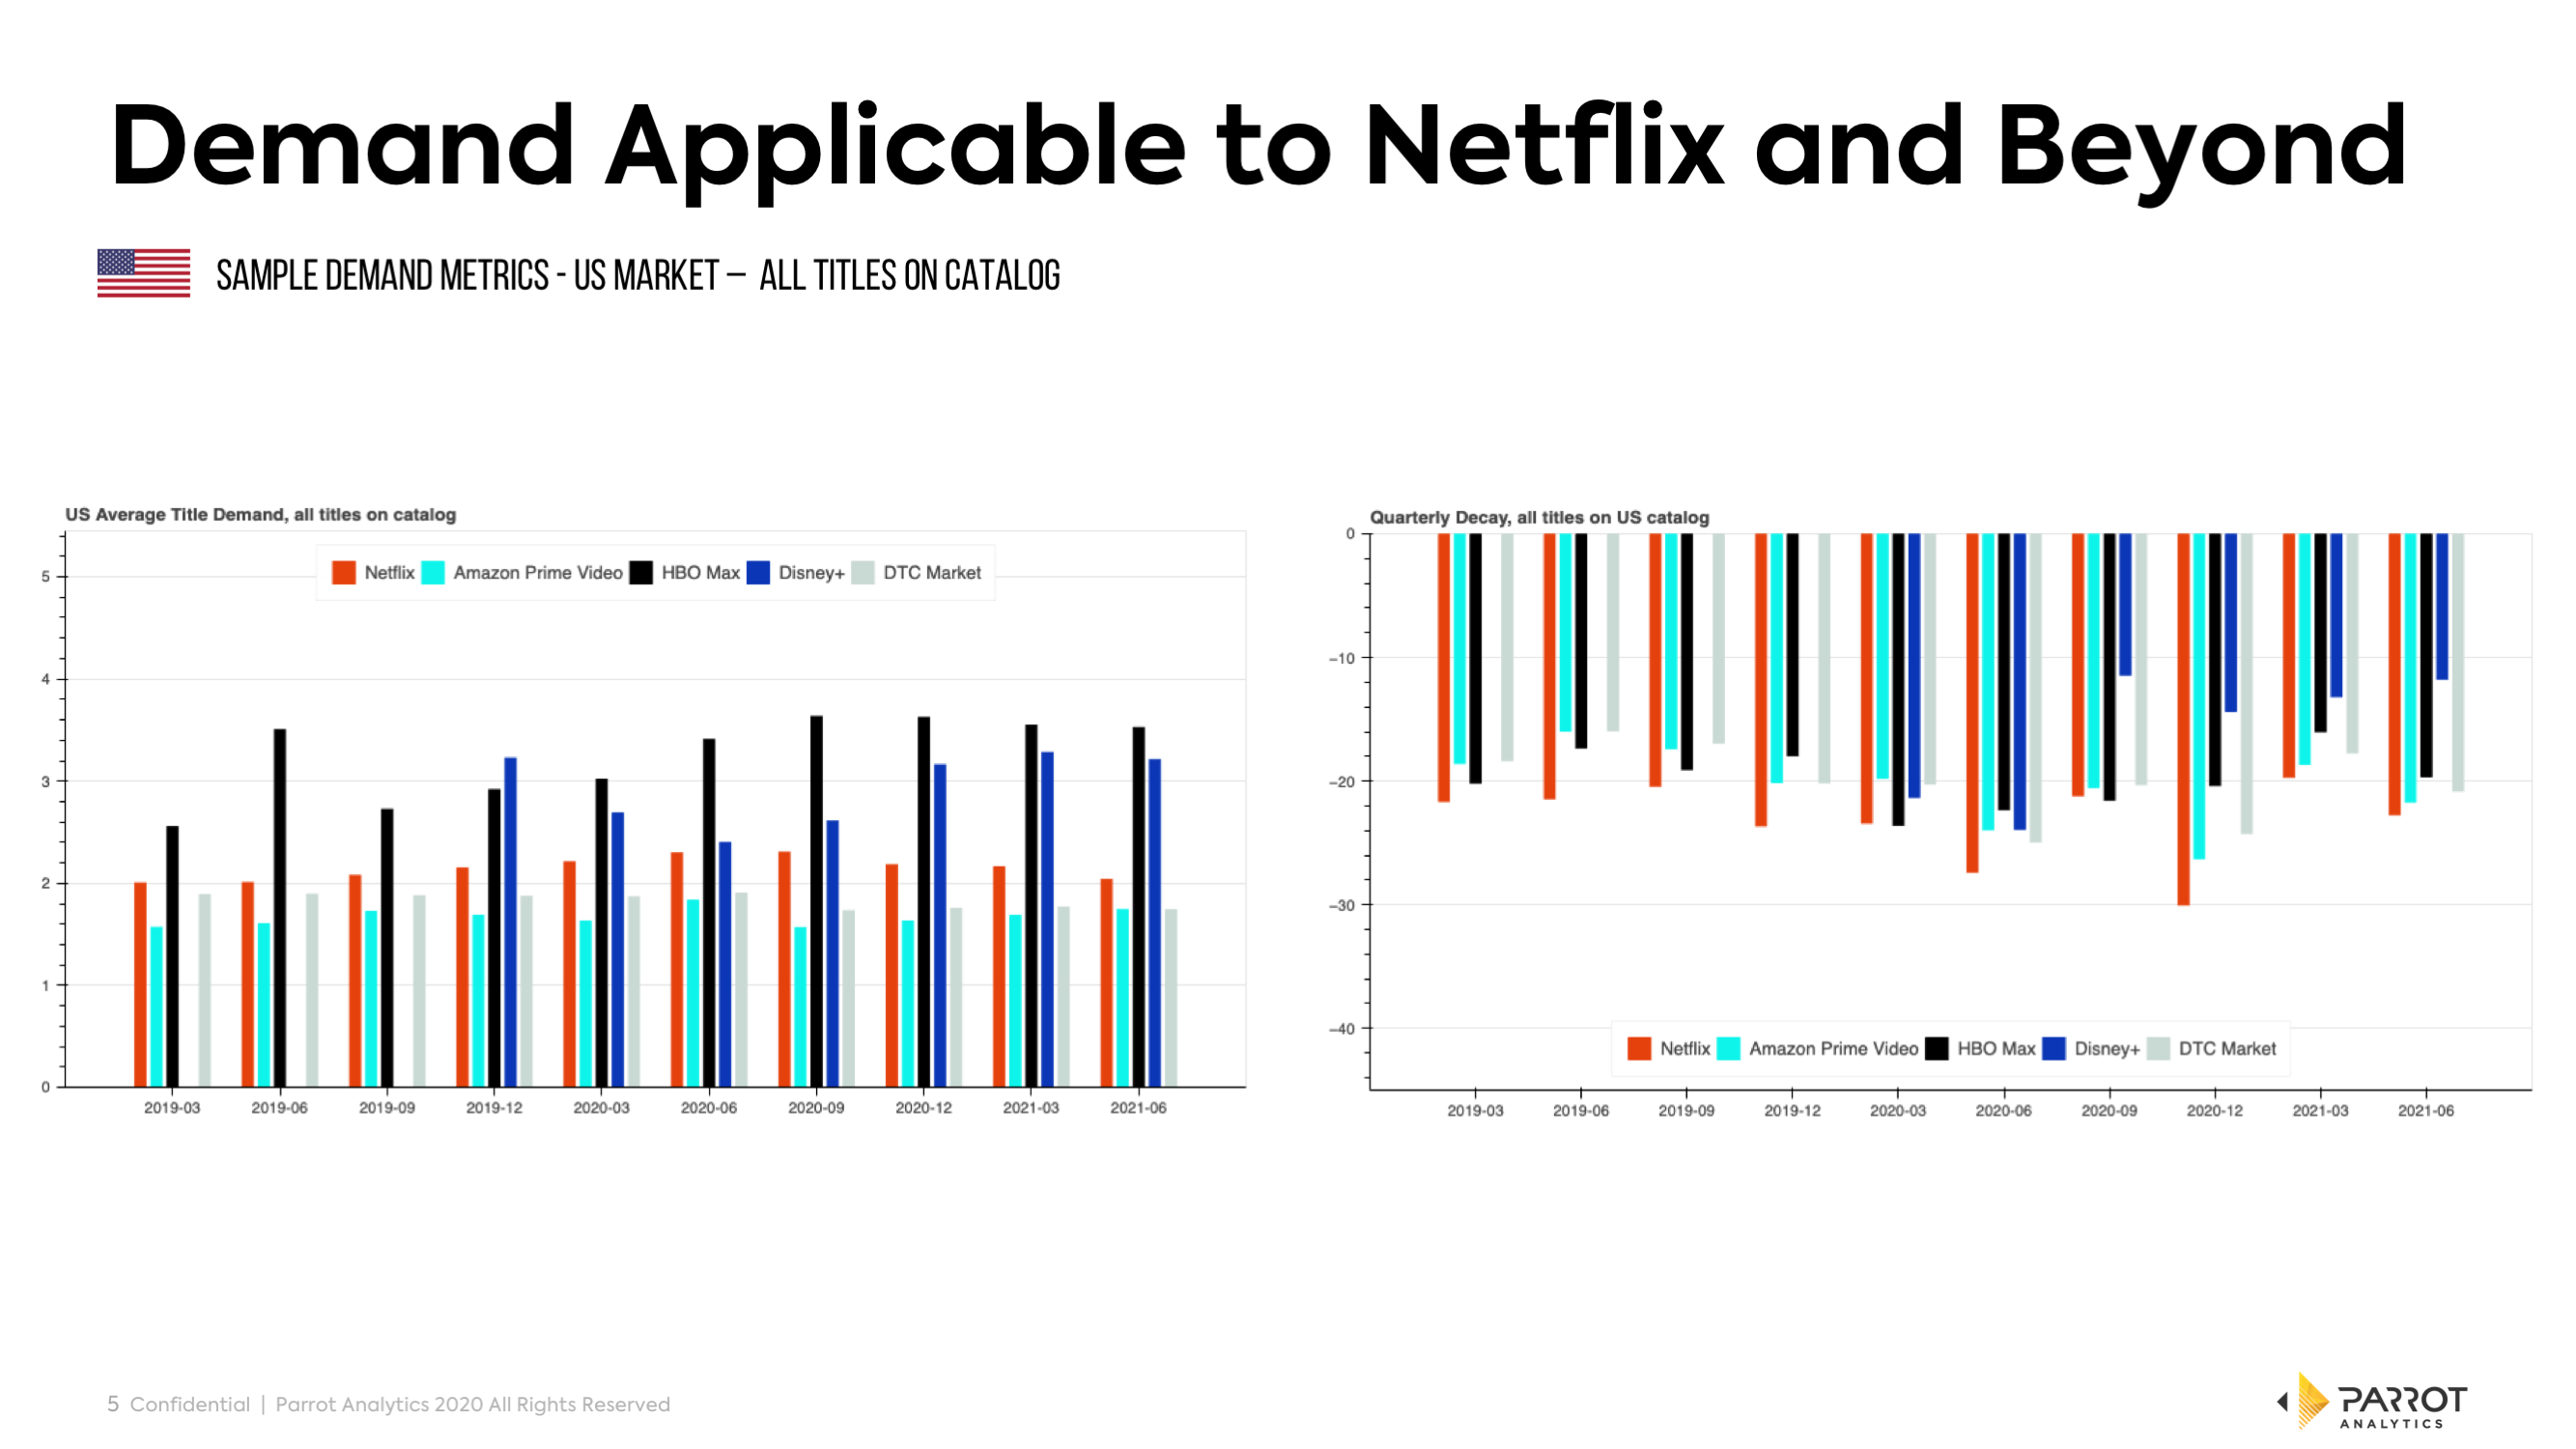
This is what makes demand so powerful, and this is why we have termed this presentation "Nowcasting", because it is not forecasting - all our data is collected in real time, all the time.
In this manner we can know that if the content is fascinating and in high demand, we can predict that a streamer will meet their subscriber figures.
Watch the whole presentation below to to gain more insights and a better understanding of this data:


