By reading this article you will learn:
How you can leverage the demand dataset to predict and optimize concurrent stream sizing to maximize planning efficiency
How using Demand to estimate concurrent streams, ensures the trends of the entire market, rather than solely the OTT’s specific ecosystem, are taken into account leading to a more accurate prediction.
How you can identify surplus available streams and capitalize on leftover white space.
As global OTT services continue to enter the streaming wars, increasing quantities and types of content will be required to sate the desires of their growing audiences. This growth and variation of content makes it increasingly difficult to predict views ahead of content launches. Teams managing infrastructure of OTT services require insight into concurrent streams of content launching on their platform to accurately provision sizing on an ongoing basis. This paper reviews specifically why and how Parrot Analytics’ demand dataset should be leveraged to predict and optimize concurrent stream sizing to maximize planning efficiency as well as capitalize on leftover white space.
Intro to Demand & its Relevancy for Predicting Global Concurrent Streams
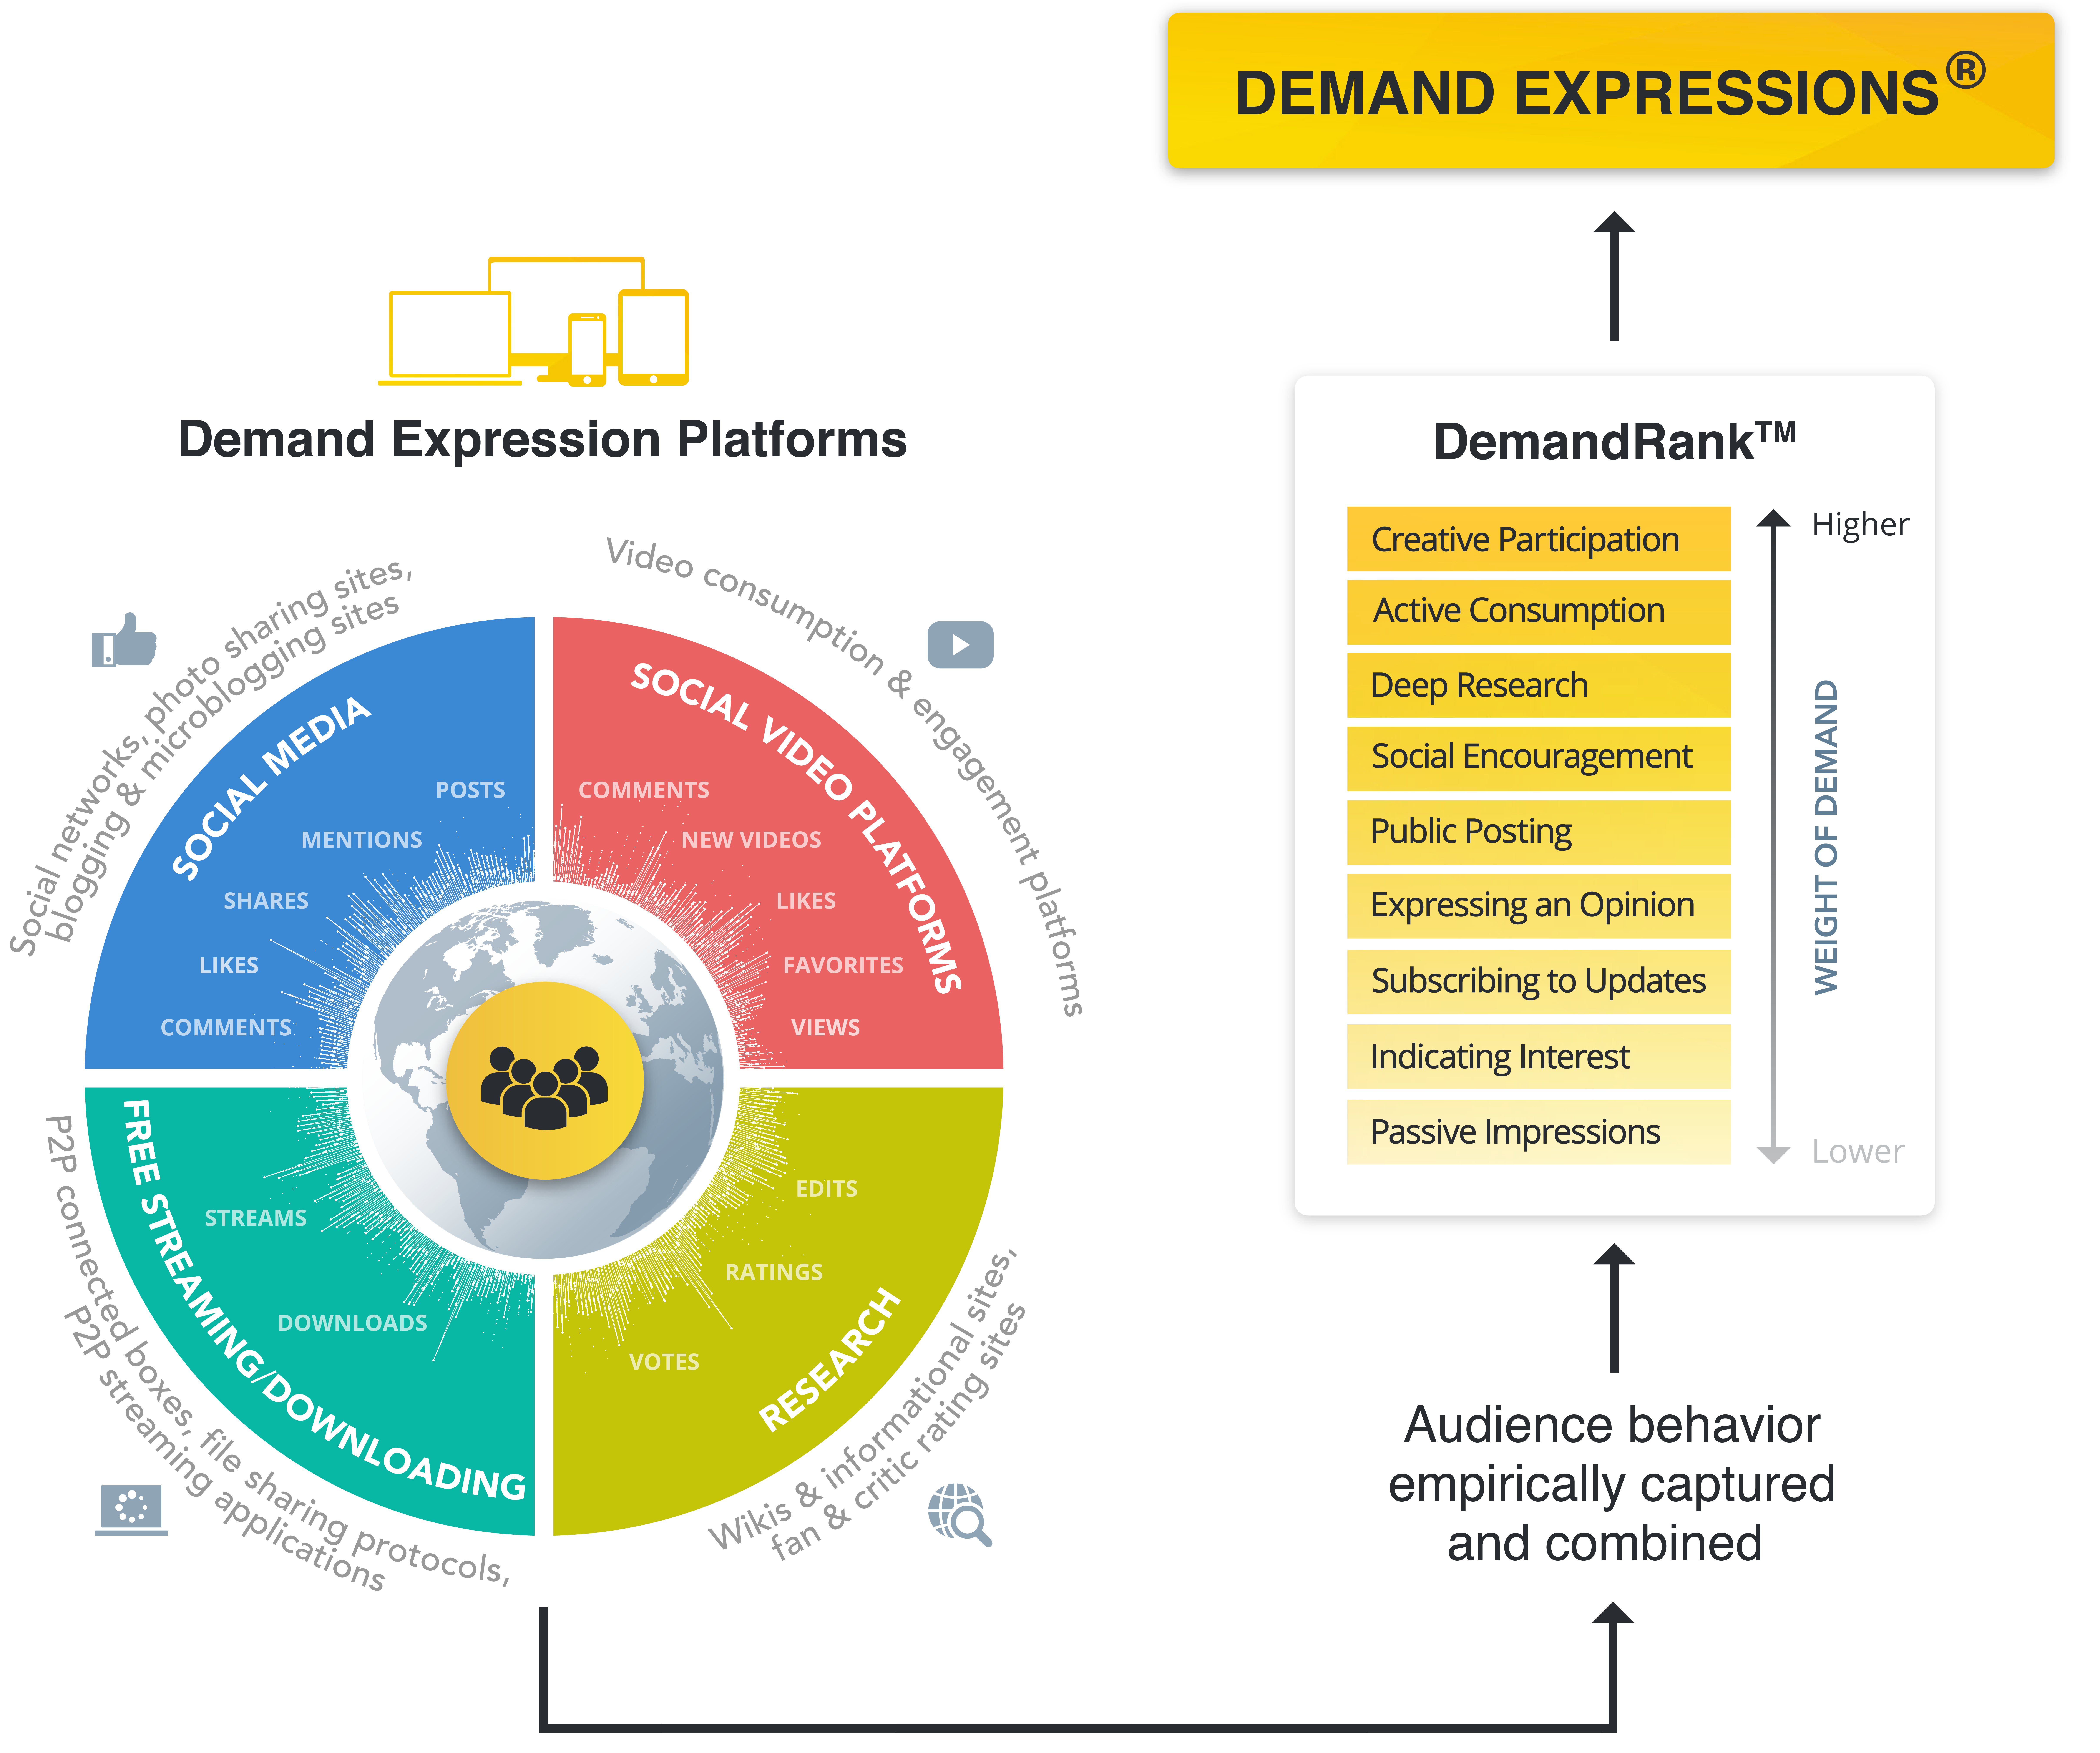
Demand for television content is what drives consumption on all platforms, such as linear TV, TVOD or SVOD services. Consumers express their demand for television shows through video streaming, social media interactions, photo sharing, blogging and micro-blogging, fan and critic rating platforms, peer-to-peer protocols, and downloading/streaming sites. Parrot Analytics captures billions of these signals from around the world empirically and then weights each signal based on the time it took the consumer to express that demand—so peer-to-peer downloading of a TV series is weighted more heavily than a simple ‘like’ on a show’s Facebook page.[1] Demand is available daily, on a market specific basis in over a hundred countries and more than a hundred languages for tens of thousands of television series/content, resulting in a comprehensive and robust dataset. Through the patented peer-to-peer data collector and analyzer,[2] Parrot powers the largest first party consumption dataset in the world in terms of both numbers of people and content.
Partnering with infrastructure teams, we can uncover the Demand relationship to any specific partners concurrent streams to arrive at a process that optimally forecasts the streaming levels, by country. AWS reports that successfully right sizing can result in savings of up to 70%, though it is an ongoing process.[3] Demand can serve as a key input, alongside partners’ internal data, to inform sizing.
Step 1: Working Together to Use Demand to Optimize Concurrent Stream Sizing
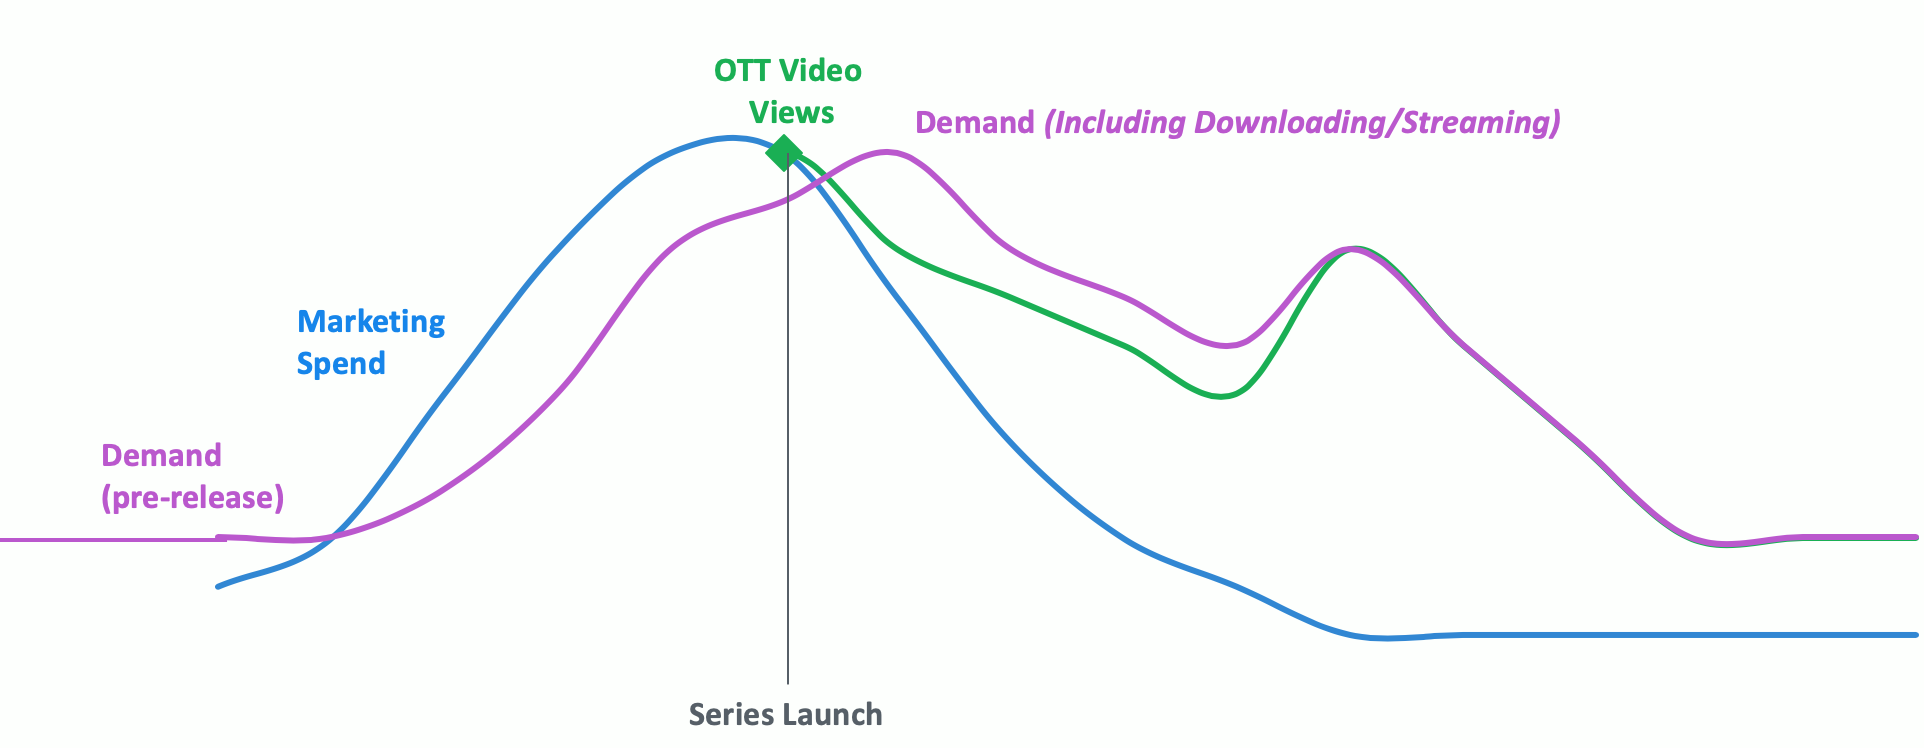
While Parrot Analytics has delved into deep analyses uncovering different Demand patterns over the years, the most effective process to optimize concurrent stream sizing is to first understand the relationship of Demand (or different facets of Demand) with a specific partner’s concurrent streams. Working together alongside infrastructure teams to provide all the data required to help determine this relationship, we can align a marketing curve that impacts the Demand curve which leads to a viewership curve.
Visualization of Parrot Analytics’ Infrastructure Considerations
In order to arrive at the above, a typical project generally explores:
- Demand peaks (when are they are highest/for which type of content/duration & decay).
- Identifying what the time frame is between the leading indicator curve in each instance (marketing over Demand and Demand over Stream).
- Uncovering the relationship variations based on Demand buckets (piracy, social, research).
- Variations based on the specific OTT’s market (explore established vs. emerging markets).
- How demand peaks can be forecasted leveraging pre-release data (12 months out, 8 months out, 6 months out).
- Identifying what the time frame is between the leading indicator curve in each instance (marketing over Demand and Demand over Stream).
- Variations by region and by market.
- Optionally, how the inclusion of Talent Demand can increase the accuracy of Demand forecasting.
Optimizing Concurrent Stream Sizing
Our solution for estimating the number of concurrent streams has 2 stages:
1. Predicting Demand
The first step in estimating the number of concurrent streams months in advance is to estimate how much demand there will be for each title at this time. This will be done for both existing titles, where current Demand data is available, and pre-release titles, where Pre-Release Demand and/or metadata is available.
The general equation for Demand prediction is:
where xDemand now are factors related to existing Demand or Pre-Release Demand for the title, xLatent are factors related to the title’s metadata (genres, subjects, talent, etc.), and xExternal are factors that are external to the title (market trends, seasonality, etc.). Note that this Demand prediction will be market- and title-specific.
Parrot Analytics provides, and integrates, this algorithmic solution with existing workflows that the content team(s) already have in place, so that they can provide the Infrastructure team with an accurate estimate of the Demand for their titles in the next 6, 8, or 12 months on a daily basis.
2. Using Demand to Predict Concurrent Streams
With the Demand estimates provided by the Content teams, infrastructure teams are able to plug this data into the second algorithm developed by Parrot Analytics which converts the amount of Demand into a prediction of concurrent streams. This algorithm is applied to each title individually, and the sum of the predicted concurrent streams across all titles will give the Infrastructure team an indication of the optimal sizing.
The general equation for concurrent stream prediction is:
where Din 6/8/12 months is the predicted Demand from the first step, λ*W is Little’s Law where λ is the arrival rate and W is the mean time in the system, and yMarketing is effect of the show-specific and platform marketing as indicated by the marketing curve in the image above. Note that this concurrent stream prediction will be market- and title-specific.
Parrot Analytics provides this algorithmic solution to infrastructure teams so the total concurrent streams from all sources in the next 6, 8, or 12 months can be taken into account for infrastructure sizing on a daily basis.
Please note, we work closely with infrastructure dedicated teams to incorporate any additional relevant internal and external data to make these estimates as accurate as possible, with ongoing work done to refine them over time. The key consideration is as follows: By using Demand to estimate the concurrent streams, the trends of the entire market, rather than solely the OTT’s specific ecosystem, are taken into account leading to a more accurate prediction.
Step 2: Leveraging the Results to Capitalize on the Content Whitespace
Once the relationship between Demand and streams has been identified, as a next step, we will work to identify surplus available streams. The surplus available streams can then be related back to Demand and can be optimized by increasing Demand either through additional marketing of existing content or the acquisition of new content to consume the surplus. Based on the delta between the number of streams provisioned and the predicted Demand, Parrot Analytics can identify existing content to promote or new content to acquire at an optimal cost/Demand ratio to fill the gap.
For existing content, we provide our partners with market-wide affinity data to identify the right content to promote to viewers to keep them engaged on the platform, thus utilizing the surplus streams. This consumption affinity dataset captures the downloads and streams on file-sharing networks, meaning that it captures the viewing behavior of the entire potential audience (in a market), not only those who engage with the specific OTT platform. Therefore, our affinity dataset used in combination with an OTT’s internal viewership data provides the best possible recommendations to users whilst ensuring that the surplus streams are consumed. With the surplus available streams related back to Demand, the OTT infrastructure teams can identify the content that leaves the most white space in terms of surplus streams and also prioritize this content for increased marketing and/or recommendations impact.
For new content, the same affinity dataset is also utilized to select the content that is most likely to be watched by the specific OTT viewers of particular titles, thereby keeping them engaged on the platform and using the surplus streams. With the surplus available streams related back to Demand, the Acquisitions team can be sure to acquire the right amount of content to fill the surplus without incurring additional cost.
With these two steps fully implemented as part of our workflow solution, our partner teams can not only more effectively predict the streams necessary to provision, but also make use of any available overage in provisioned streams as Demand for a given title, or group of titles, decays.
[1] More information on the Demand metric and what it incorporates can be found in the Appendix: Item #1: Understanding Demand Data.
[2] Complete details on Parrot Analytics’ patented peer-to-peer data collector and analyzer can be found at https://patents.google.com/patent/US20150294331A1/en
[3] Right Sizing: Provisioning Instances to Match Workloads, March 2018, Amazon Web Services Inc. https://d1.awsstatic.com/whitepapers/cost-optimization-right-sizing.pdf?trk=wp_card
Footnote: Understanding Demand Data
Parrot Analytics provides a global Demand metric which incorporates billions of signals on a daily basis capturing all the different ways consumers can express demand for content online. Demand for content is finite. Over 2 billion consumers discover, research, express interest and consume content all online through a plethora of platforms with varying degrees of effort on a daily basis. Demand measurement captures these signals and weights them resulting in a single metric that informs the industry on what content is most in-demand in each country around the world, across all platforms.


