Interested to have your IP's value appraised? Reach out to us to value your TV series, film, catalog or franchise. Learn more about our streaming economics products.
Executive Summary
To truly understand the economics of streaming, and to be able to measure the value of content in today’s attention economy, requires a global and holistic measurement approach:
- Audiences interact with and express their demand for content through multiple touch points in today’s attention economy.
- Parrot Analytics captures those touch points and combines them into a single holistic measure of audience demand for every title, in every market around the world.
- Audience demand is directly correlated with subscribers (R-squared > 0.9), and therefore revenue, on streaming services globally.
- Parrot Analytics’ Content Valuation system can measure the revenue every title contributes to each streaming service, in each market.
- The system is also able to differentiate how each title generates value for each streaming service (broken down by user acquisition and retention) in each market around the world.
Read on to understand why this changes everything.
1. The global measurement system for today’s attention economy
Audiences interact with content through multiple touchpoints in today’s attention economy, and only Parrot Analytics captures the entire consumer journey on a global scale. Total attention plays out in many forms including research, interaction, sharing, active consumption and creative participation of content.
When people are fully engaged, they express their demand for content in a plethora of different ways across multiple channels, apps, and devices. From long form film and TV viewing to short form video views, and from research to social media activity, audiences around the world are constantly expressing their demand for all types of content, across all channels, networks, and streaming services.
Our global entertainment analytics system captures all the touchpoints people use to interact with content, and combines these interactions into a single measure of attention. We call this audience demand.
2. Why a multi-touch "share of attention" approach is critical to quantify value
With an unprecedented amount of content and distribution pathways available, today’s audiences have more ways of viewing and interacting with entertainment than ever before. In order to understand, anticipate and react to modern day consumer behavior, it is crucial to capture their full interactive and overlapping journeys with content, talent and brands.
Otherwise, determining the value of every piece of entertainment is rapidly becoming impossible when using traditional measurement (accounting) practices:
- Which films are attracting high value customers to a burgeoning streaming service?
- Which series are retaining high risk customers on streaming services?
- Of all the content not yet available on a given streamer, which specific titles would help that streamer acquire the most users for the lowest cost?
- What brands are engaging audiences across different streamers and TV channels in various countries?
- What type of series are working for a streaming platform in a binge format, and what titles would better serve this platform via episodic release?
These are just some of the many questions that Parrot Analytics can answer through its unique approach that empirically maps the intersection of audience interest and true consumption globally.
All these questions build up to the most significant question for everyone along the content value chain:
How much revenue is this title generating, or able to generate, in the chosen distribution method?
Determining the answer to this question relies on being able to create a 1:1 comparison between titles across all streaming services, in every country, every single day. And this, in turn, relies on a combination of actual consumption data, short-form video views, search queries, social media engagement, research actions and more to fully quantify the entire consumer journey. Parrot Analytics’ content consumption dataset alone measures the empirical consumption of hundreds of millions of households in every market globally, powering the entertainment industry’s most comprehensive and dynamic audience behavior dataset.
Furthermore, weighing every interaction based on the amount of attention it captured – for example, actual consumption is weighted exponentially higher than social media activity – when calculating Parrot Analytics’ daily country-specific demand metric allows for a stronger, direct relationship to what actually drives revenues (more on that in the next section).
In a fragmented landscape, this multi-touch attention measurement approach is the only scalable solution to ultimately quantify the full value of content across all distribution models and markets globally:
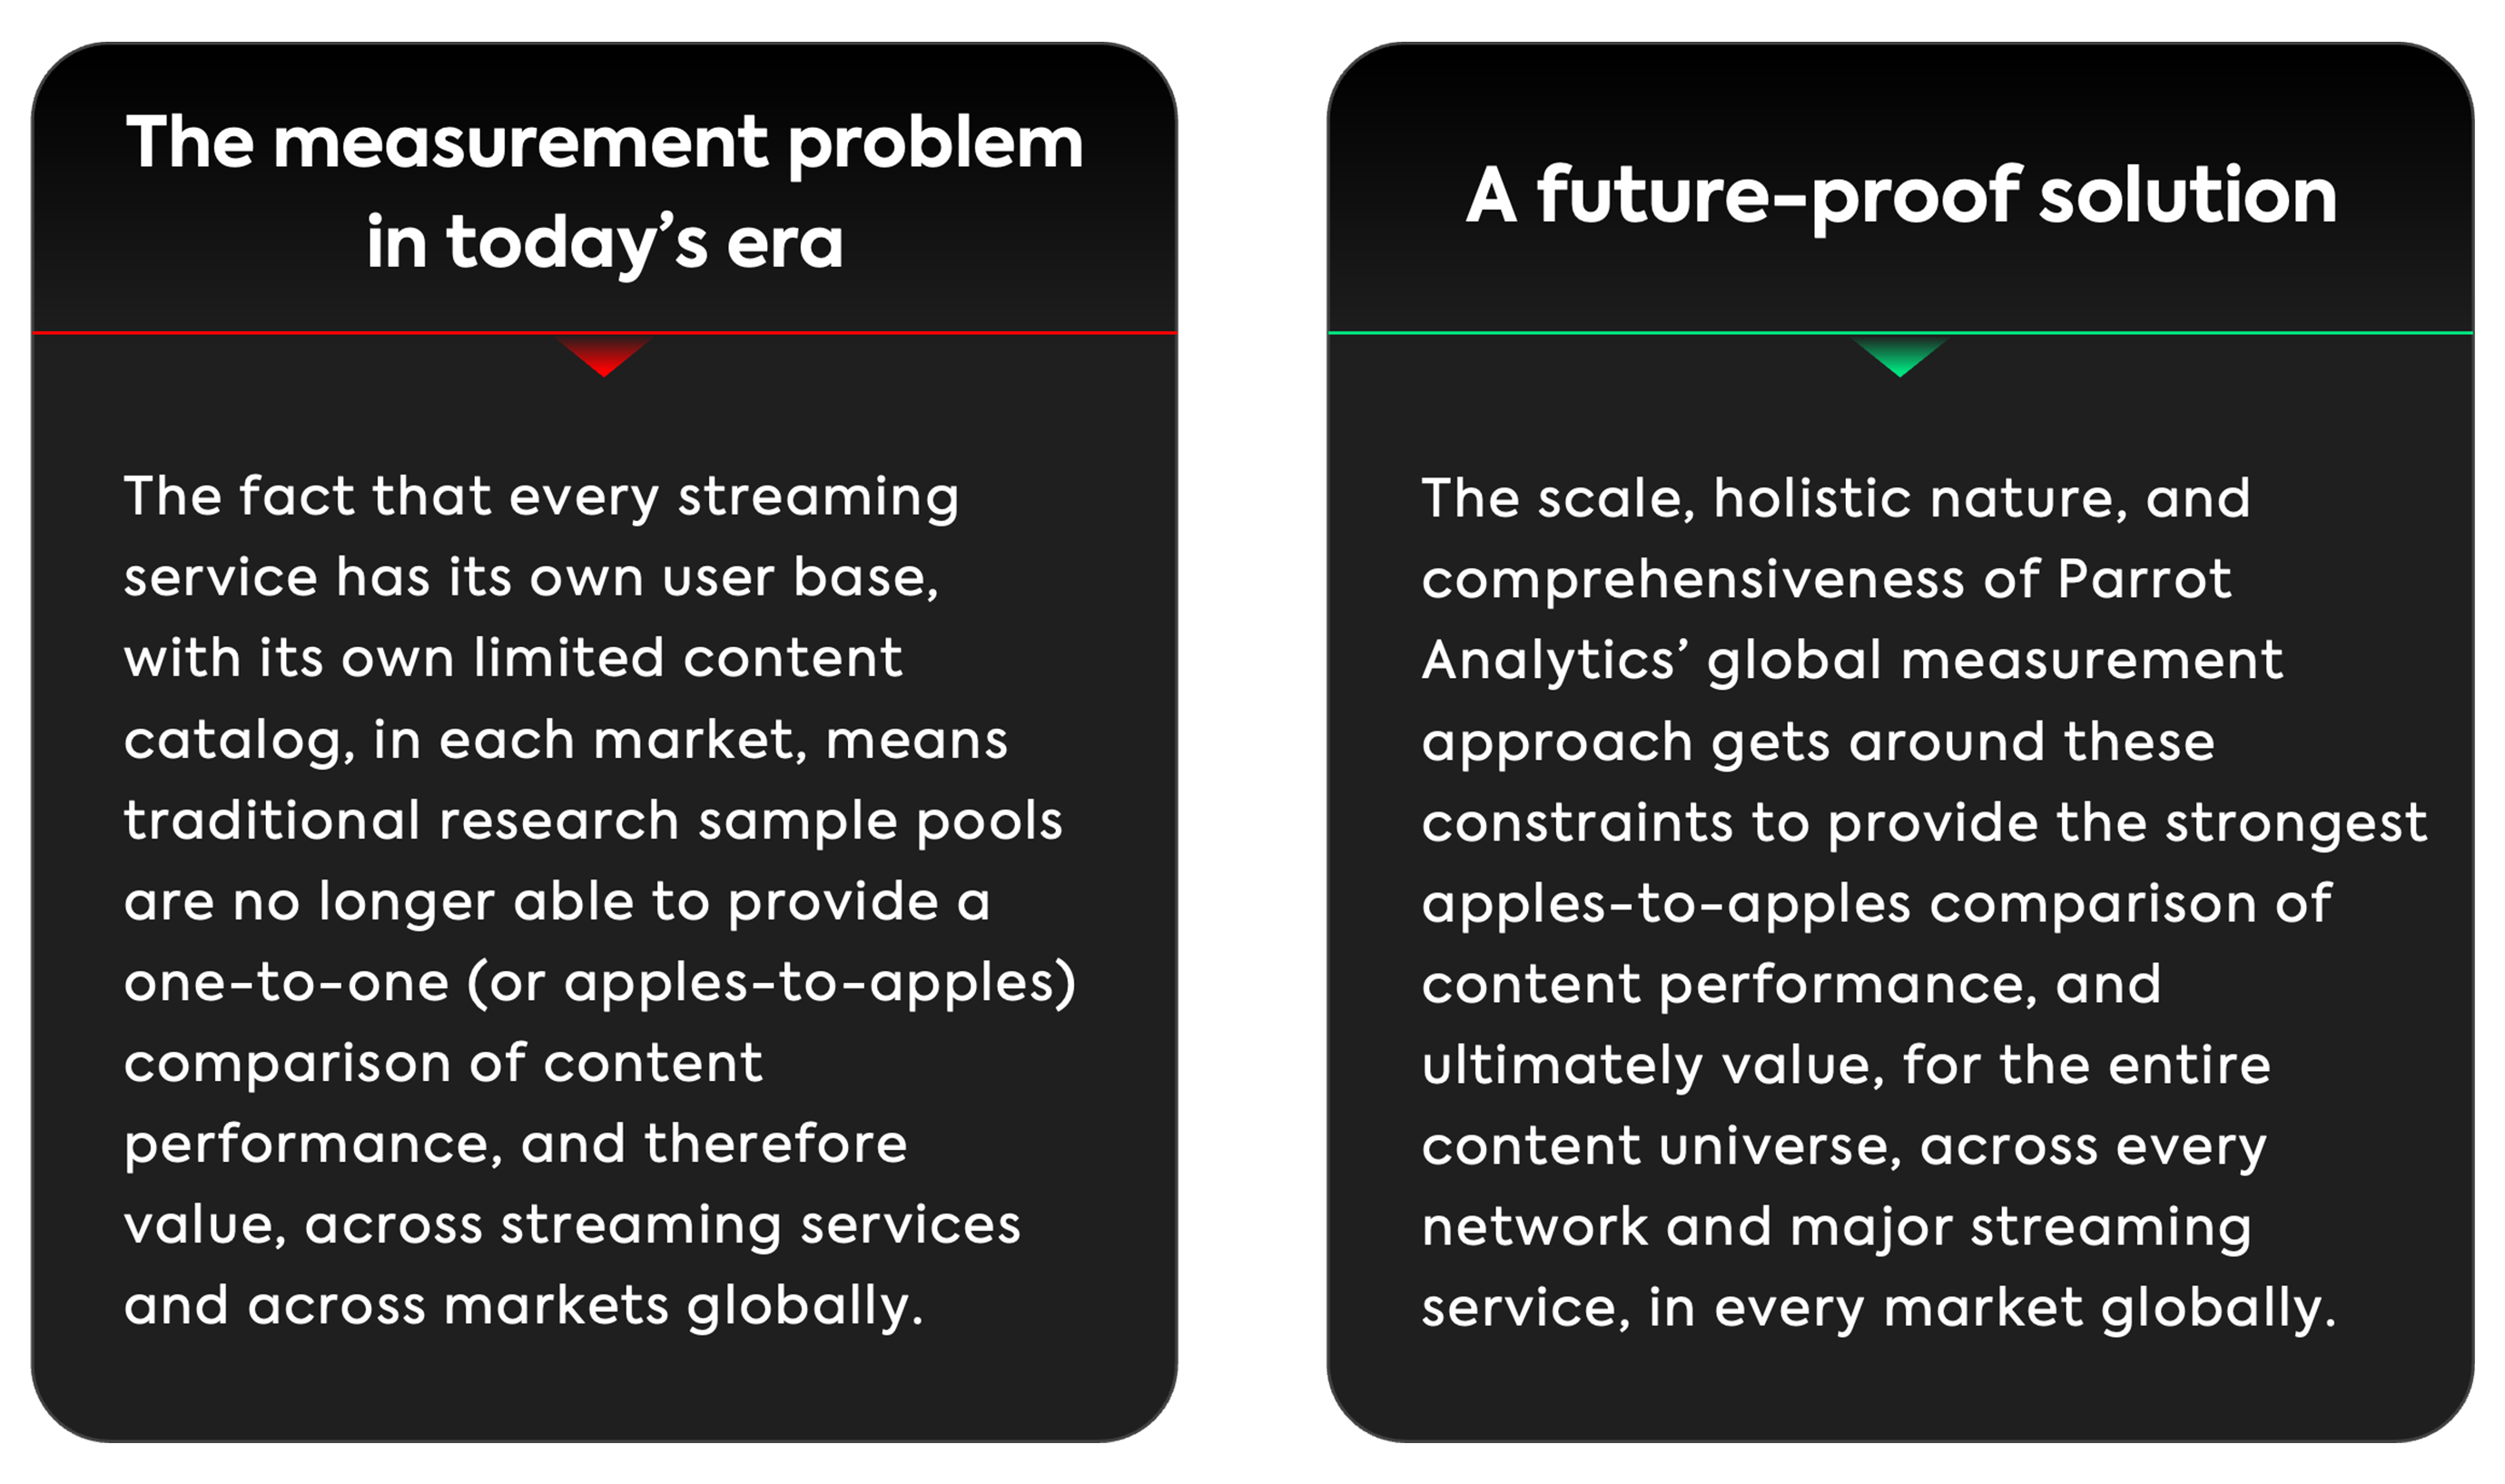
So, Parrot Analytics measures the empirical audience demand for content across all networks and streaming services, in every market globally. How does that translate to a precise dollar value?
3. Demand measures the direct revenue impact of content
At any given point in time, over two billion audiences globally express demand in different ways that Parrot Analytics measures. This results in the largest collated audience behavior datasets in the entertainment industry, which include first-party content consumption data from hundreds of millions of households around the world.
As covered earlier, every consumer interaction is weighted according to the attention that signal captured from the consumer. This means, for example, content consumption is weighted heavier than social activity, search, and many other audience signals. This approach allows Parrot Analytics to:
A) Ensure the demand metric is the most robust measure of value in the attention economy, ultimately translatable to revenue.
B) Leverage all the different types of audience signals to understand the nuances of the role that every title plays for a streaming service: audience willingness to sign up to a streaming service to watch it (acquisition) and likelihood of staying on that streaming service because of its presence (retention).
At the heart of Parrot Analytics’ thesis for Content Valuation in the media and entertainment industry is supply and demand microeconomics. If you are able to tag the global supply of content (all content, in all languages, in all markets) as well as measure the country-specific demand for each of those titles, then you can measure the pricing power of every title, as well as any bundle of titles (for example, a production company slate, or a streaming service catalog).
This is precisely what Parrot Analytics has built over the past 10 years.
To validate the hypothesis that demand as a measurement translates to the direct revenue impact of a title, a relatively simple exercise can be carried out to explain the variability in the unit economics of both small and large streaming services. Indeed, when looking at Parrot Analytics’ demand correlation to subscriber growth, retention, and losses at streaming services, including Netflix – in all four reported regions – Parrot Analytics see a consistent correlation of over 90% between catalog demand and subscriber numbers, quarter-on-quarter, year-on-year:
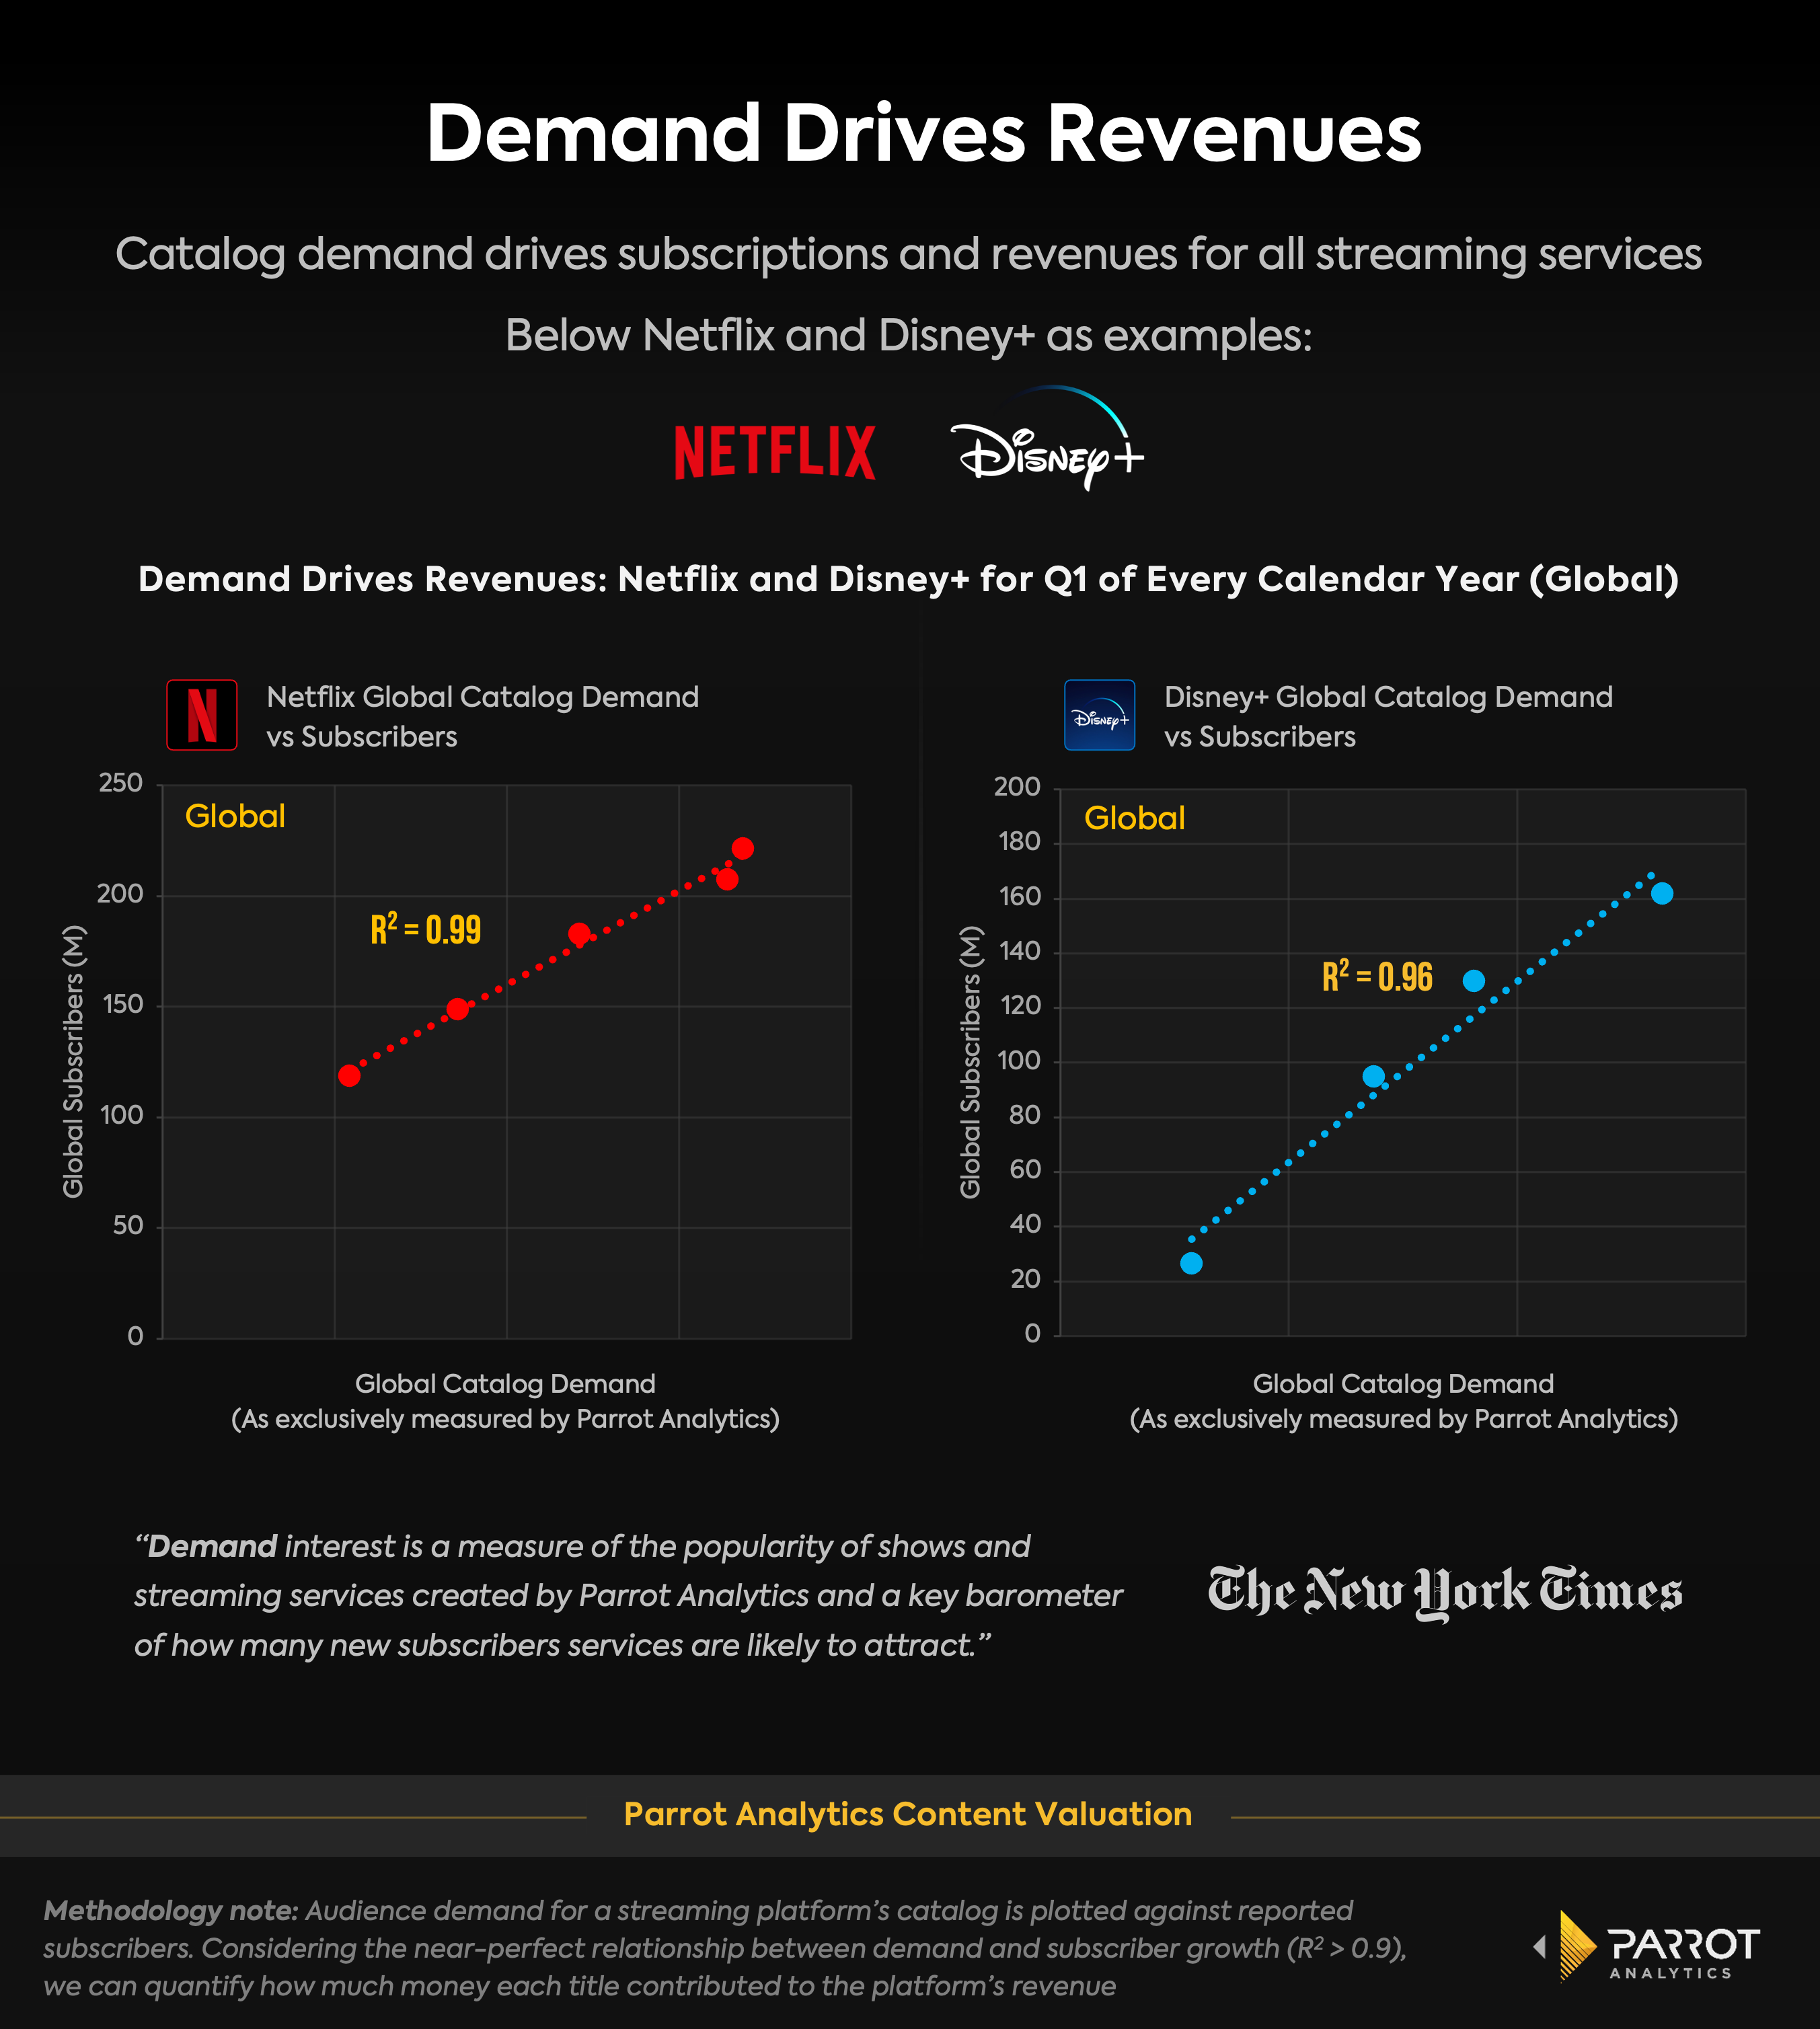
One question that Parrot Analytics receives from both creative and studio partners alike is how the Content Valuation system takes into account subscriber figures from companies that don’t disclose those updates as part of quarterly earnings, such as Apple TV+ or Amazon Prime Video. Since Parrot Analytics’ demand measurement system sees a >.9 R-squared correlation to subscriber growth across all major platforms that disclose subscriber figures as part of earnings, Parrot Analytics can project with near certainty the base subscriber, and subscriber growth or loss, for all other services that don’t report, including Apple TV+ and Amazon Prime Video.
Because we can prove that demand directly drives subscriber growth, and because we know how much every subscriber pays for every service in each market, this means:
If you can measure the demand for a title in a market, you can measure its monetary value in that market.
4. Assigning a precise $ value figure for each title, on each service, in each market
In statistics, R-squared (also called a "coefficient of determination") is a measure that explains the extent to which changes in one variable can predict changes in another variable. An R-squared of 1 means that 100% of all movements of one variable are completely explained by the movements of another variable.
As established above, Parrot Analytics has routinely observed an R-squared of 0.9 (or higher) between audience demand for titles and reported subscriber figures for major streaming services. This relationship also holds across markets globally, meaning that demand for content drives revenue growth in individual markets and regions. For example let us look at the United States and Canada (UCAN), again using Netflix's self-reported subscriber numbers and Parrot Analytics' demand data for this region:
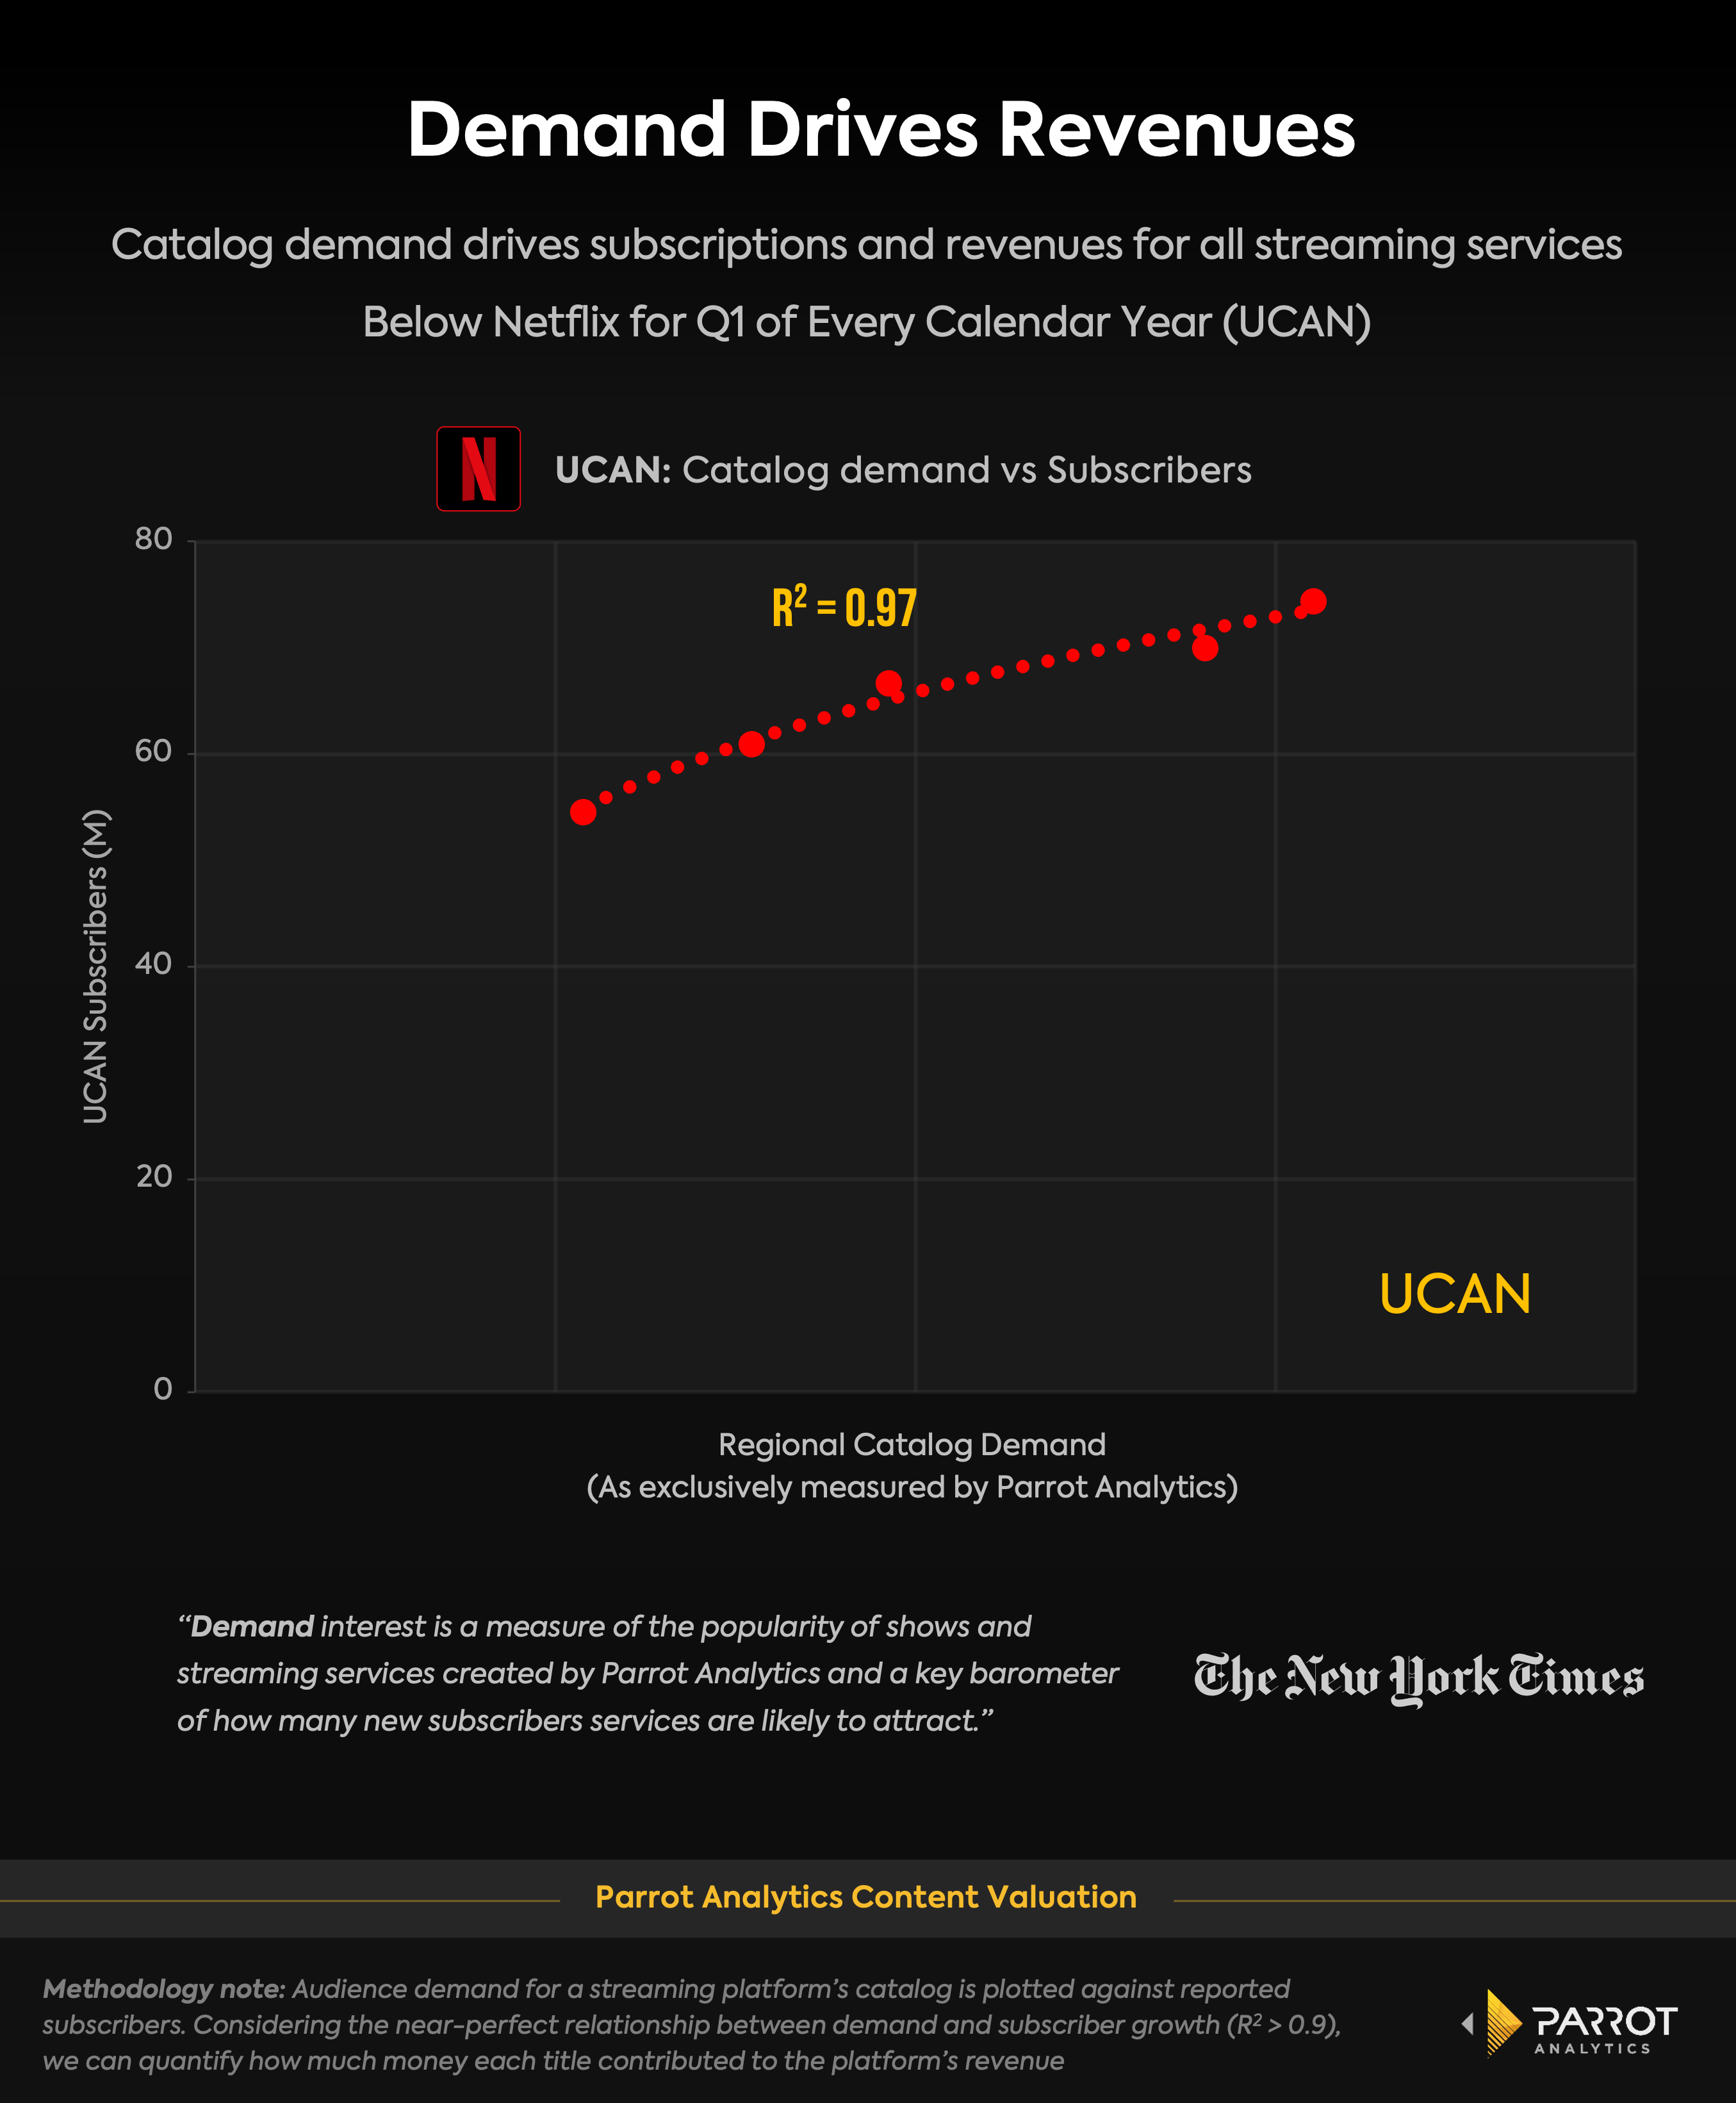
Because of this, Parrot Analytics can use demand for a title as a key driver in determining the monetary value of that title.
Yes, this also means if you can measure the demand for a title before it is available on a streaming service, you can measure the economic impact it would have on that streaming service.
Importantly, this also includes the ability to determine the revenue contribution of a title including advertising contributions. Parrot Analytics leverages data from FAST and AVOD platforms, and leverages financial data from those same platforms. Therefore, by collecting information about how titles perform in an advertising-heavy environment, and determining what titles audiences are engaging with heavily on a more frequent basis can help determine the additional revenue contribution a title might contribute to an advertising tier or within an advertising heavy service.
This means the industry can now answer questions such as:
How much revenue has Squid Game contributed to Netflix in the United States and Canada (UCAN) in Q1 2023?
To determine the exact revenue contribution, it is also important to look at audience consumption patterns in addition to the title's overall demand. Titles generate value in different ways for streaming services. Some titles drive user acquisition, others are great for keeping users engaged, and some perform a critical role in preventing users from churning off the streaming service. All of these titles are valuable, and understanding the role that each plays is critical to a thriving industry.
Crucially, because of how rich the underlying multi-touch datasets are, Parrot Analytics’ Content Valuation system is also able to drill down into how each title generates revenue for streaming services.
5. Each piece of content adds value by driving new sign-ups and monthly renewals
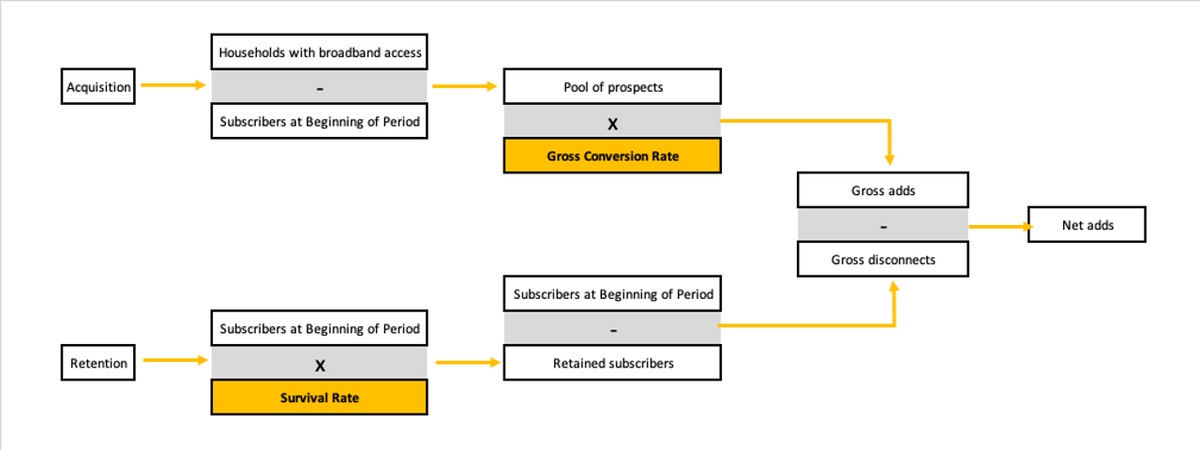
Every title adds value to a streaming service by acquiring new and retaining existing subscribers.
That means the revenue a title generates can be measured as the subscription impact that is made up of new sign ups and monthly renewals.
These two title-specific, market-specific, and service-specific dimensions of value make it plain to see to what extent one title might be better at bringing in new subscribers to a given streaming service, or whether a title is especially good at retaining subscribers.
Parrot Analytics’ unique cross-platform consumption datasets allow us to create look-alike audiences for subscribers and non-subscribers to predict their behaviour and content preferences.
For example, to determine the new sign-up and renewal subscription impact of Stranger Things to Netflix in UCAN in Q3 2022, we model two audiences - one that behaves like Netflix subscribers (i.e. they watch on-platform content) and one that behaves like non-subscribers (i.e. they watch off-platform content).
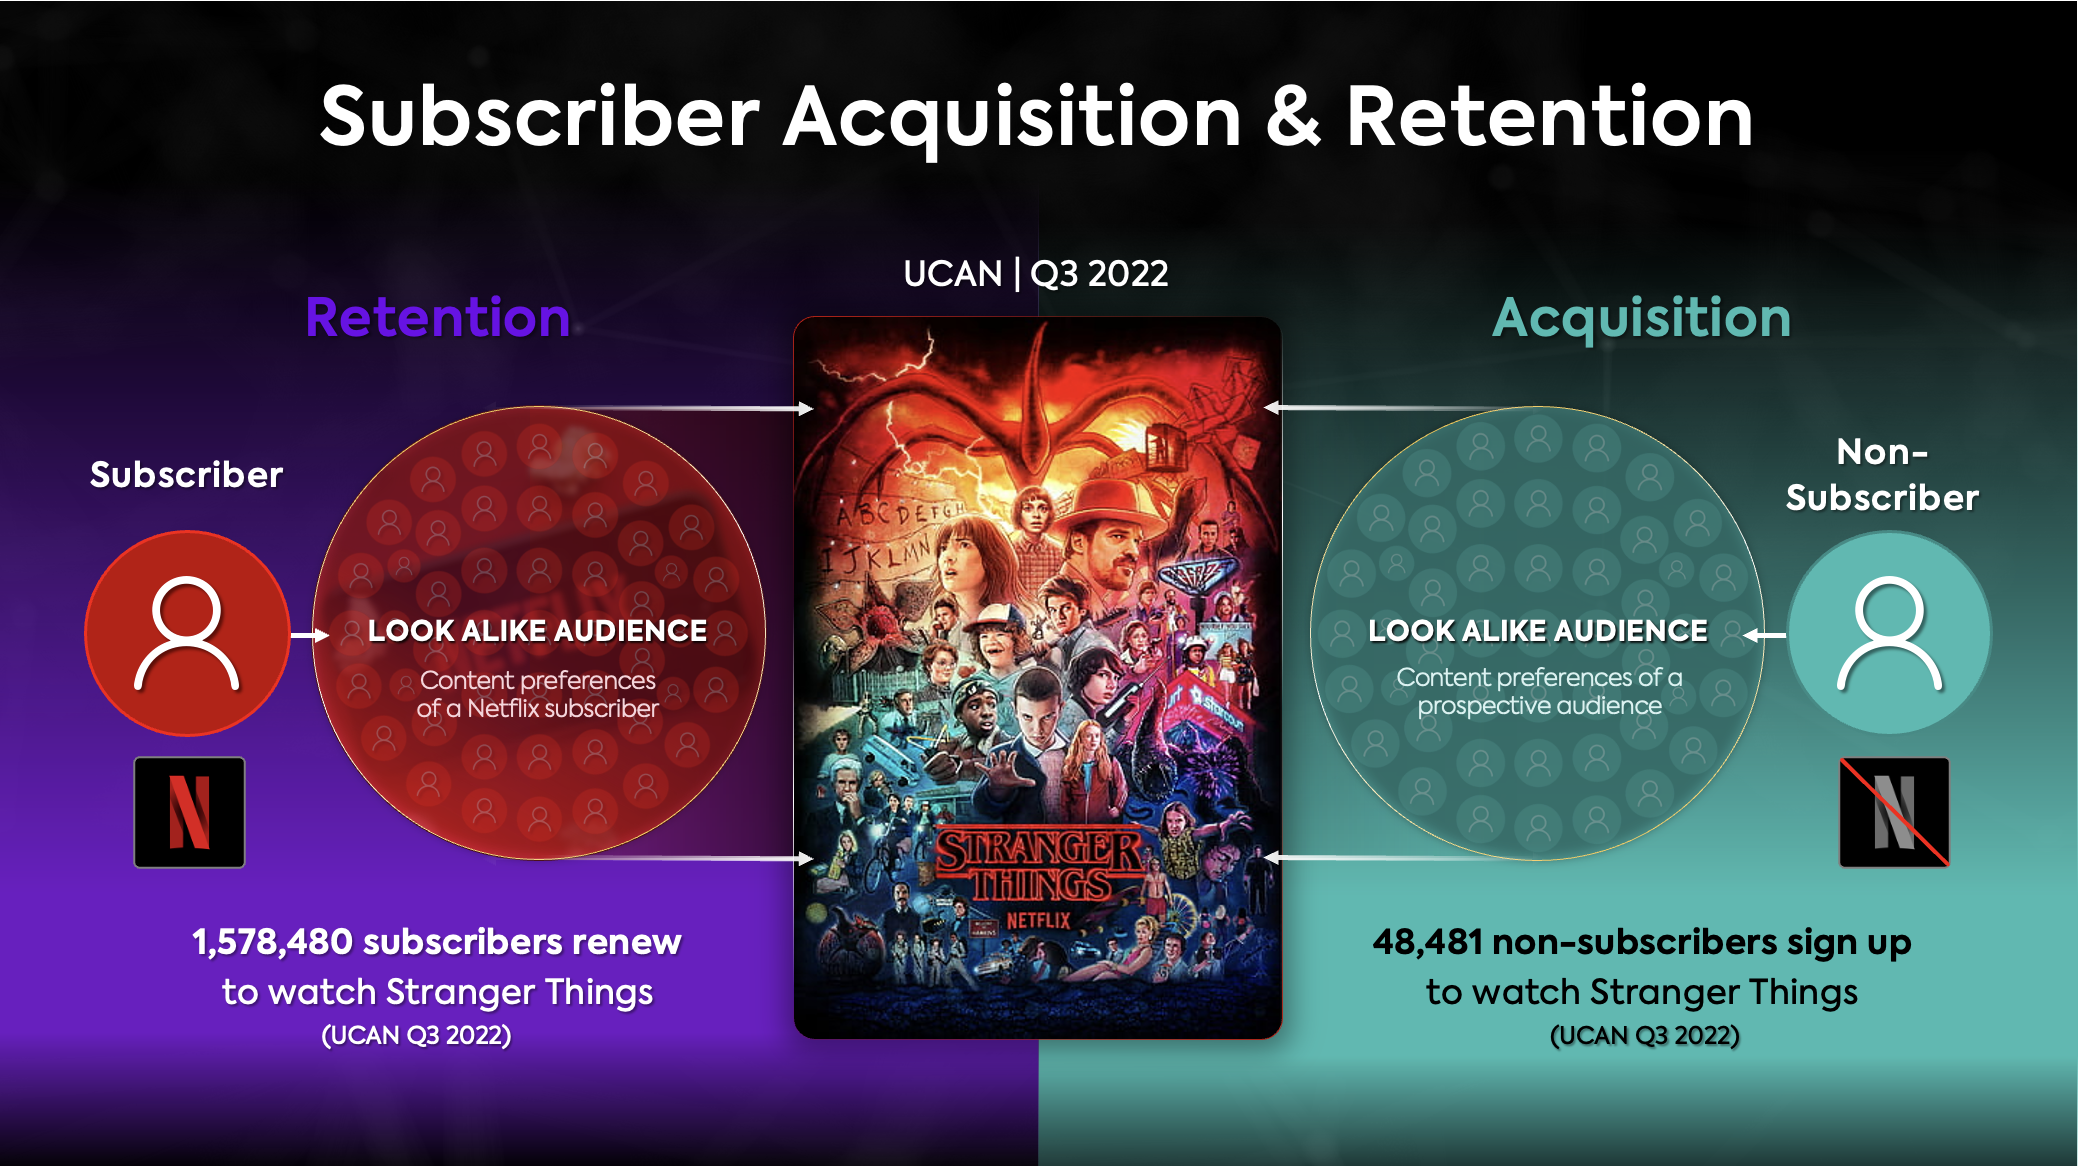
Combining ARPU from our Streaming Metrics system, we can model that 1.58M subscribers renew to watch Stranger Things and 48.48K non-subscribers sign up to watch the show - which means the show contributed $79.91M in revenue to Netflix in UCAN in Q3 2022.
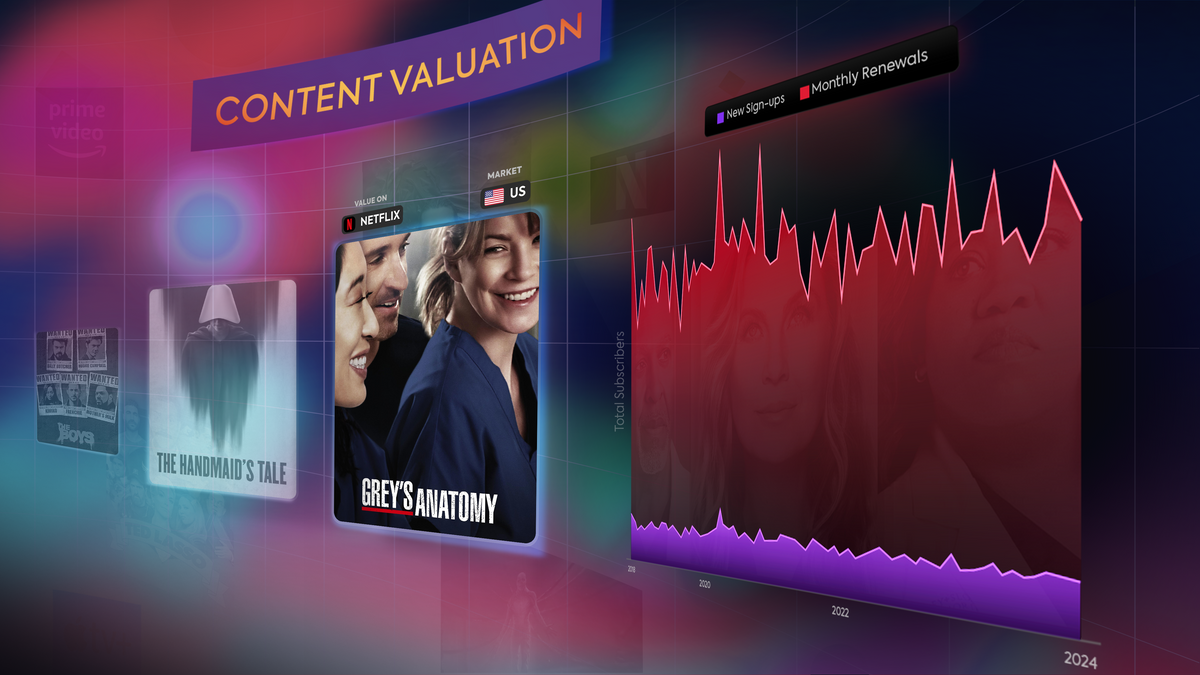
What makes matters more complex is that the same title can perform two very different roles for two streaming services, in the same market. For example, we know that Grey’s Anatomy has a particular type of importance to Netflix, compared to other streaming services like Disney+.
Let's take a look at this in more detail by delving into Parrot Analytics' Audience Journeys dataset:
Here we can see that 39% of Grey’s Anatomy’s audience picks up the show after watching a Netflix title (compared to 8% that come from a Disney+ show). The title is therefore a significant retention driver for Netflix. The show is, in fact, unique in performing that role for Netflix, which has a limited set of titles that appeal to the show’s audience (only 5% of Grey’s Anatomy’s audience picks up a Netflix show after watching it), incentivizing the streamer to license as many hours of the show as possible – of course provided it is economically feasible to do so (cost is an important factor in the ROI equation):

Understanding what would drive acquisitions and retention for each service, in each market, maximizes the $ yield for each title on an ongoing basis.
However, because streaming services can only see what content is working within their own individual systems, it means today’s fragmented streaming model has made it impossible for the industry to understand cross-platform behaviors using traditional measurement approaches. So much so that even if, as unlikely as it may be, streaming services decided to pool all their internal viewership datasets together, they would still not be able to identify how audiences leave one streaming service and sign up to another. This is because each service can only measure audience journeys within its own catalog, where once a user leaves the service, that user’s journey ends.
This is precisely what Parrot Analytics’ Content Valuation system provides. Based on each title’s audience overlap with every other title on every network and streaming service, that title’s specific value to each service can be calculated within each market. Some titles might be performing OK on Disney+, but would create much greater value if they were available exclusively on Netflix. Other titles’ value might be best exploited if they were available on a FAST channel, and on a non-exclusive basis, concurrently on another SVOD service.
Most importantly, the data’s comprehensiveness allows for deep analysis of a platform's streaming economics: Where streamers are losing subscribers, where there is potential to gain subscribers and which titles are best at driving audience engagement - and therefore competitive differentiation for each platform on a market-by-market basis. For more information on this, please take a look at our Streaming Metrics product.
In addition, Parrot Analytics’ expansive metadata systems and taxonomy groupings are also leveraged on the supply-side of the equation to inform decision making. Various ancillary datasets are available, from audience demographics and sentiment to brand affinity (for those monetizing through ads), to further help maximize the monetization potential of each title, each streaming service and ultimately the entire industry.
Recapping: The future of Content Valuation in the attention economy
Content valuation has become more challenging and crucial in today’s attention economy, where audiences have multiple ways to interact with content across different platforms. Traditional methods cannot capture the full picture of consumer behavior and content value. Parrot Analytics solves this problem by measuring global audience demand for content, a single metric that reflects how much attention each piece of content is capturing in each market.
Demand for content directly drives subscriber growth and revenue, and can therefore be used as a key input to measure the revenue contribution of every individual title to each streaming service. The value of every piece of content can further be broken down into two types of subscription impact: User acquisition and retention.
This allows for a comprehensive and consistent comparison of content value across titles and streaming services, helping creators and streaming services alike to optimize their earnings.
Unlike every other industry metric, global audience demand data as exclusively measured by Parrot Analytics is directly connected to content value. And unlike any other system, with Content Valuation the industry is able to drill down deeper and explain how that value is created on a title-by-title basis, for every streaming service, in every market around the world.
From green lighting and commissioning to licensing and acquisitions, from cancellations and renewals to sales and distribution, from programming and windowing to release planning and marketing, from editorial curation to discovery and recommendations; Parrot Analytics’ entertainment analytics and content valuation solutions exist to help every stakeholder across the entire entertainment industry thrive.
Welcome to the new era of streaming economics, powered by Parrot Analytics.


